Note
Go to the end to download the full example code.
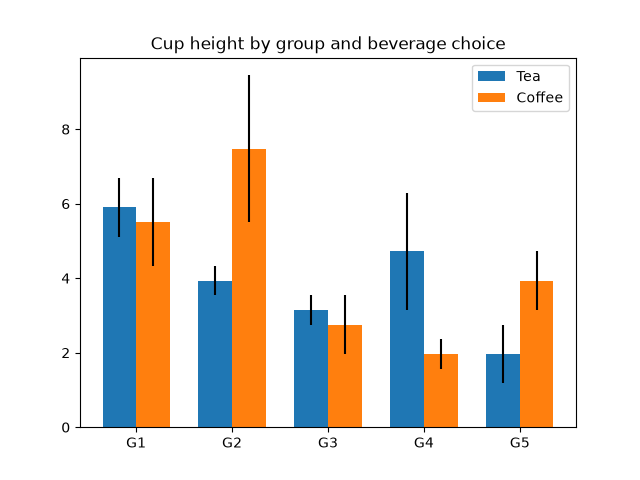
Group barchart with units#
This is the same example as the barchart in centimeters.
This example requires basic_units.py
from basic_units import cm, inch

import matplotlib.pyplot as plt
import numpy as np

N = 5
tea_means = [15*cm, 10*cm, 8*cm, 12*cm, 5*cm]
tea_std = [2*cm, 1*cm, 1*cm, 4*cm, 2*cm]

fig, ax = plt.subplots()
ax.yaxis.set_units(inch)

ind = np.arange(N)    # the x locations for the groups
width = 0.35         # the width of the bars
ax.bar(ind, tea_means, width, bottom=0*cm, yerr=tea_std, label='Tea')

coffee_means = (14*cm, 19*cm, 7*cm, 5*cm, 10*cm)
coffee_std = (3*cm, 5*cm, 2*cm, 1*cm, 2*cm)
ax.bar(ind + width, coffee_means, width, bottom=0*cm, yerr=coffee_std,
       label='Coffee')

ax.set_title('Cup height by group and beverage choice')
ax.set_xticks(ind + width / 2, labels=['G1', 'G2', 'G3', 'G4', 'G5'])

ax.legend()
ax.autoscale_view()

plt.show()