Note
Go to the end to download the full example code.
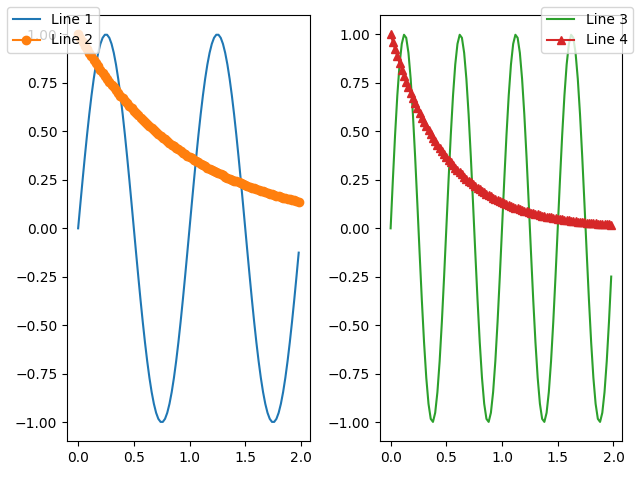
Figure legend demo#
Rather than plotting a legend on each axis, a legend for all the artists on all the sub-axes of a figure can be plotted instead.
import matplotlib.pyplot as plt
import numpy as np

fig, axs = plt.subplots(1, 2, layout='constrained')

x = np.arange(0.0, 4*np.pi, 0.2)
axs[0].plot(x, np.sin(x), label='Line 1')
axs[0].plot(x, np.exp(-x/2), marker='o', label='Line 2')
axs[1].plot(x, np.sin(x), color='tab:green', label='Line 3')
axs[1].plot(x, np.exp(-x/4), color='tab:red', marker='^', label='Line 4')

fig.legend(loc='outside right upper')

plt.show()
The outside positioning is discussed in detail here: https://matplotlib.org/stable/users/explain/axes/legend_guide.html#figure-legends
See also
The Legend guide contains an in depth discussion on the configuration options for legends.