Note
Go to the end to download the full example code.
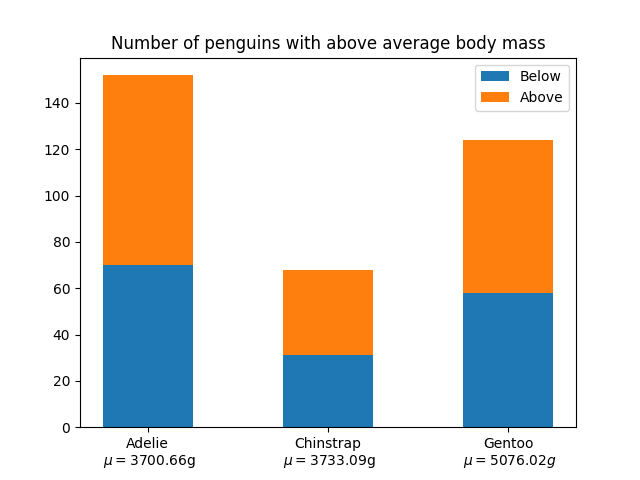
Stacked bar chart#
This is an example of creating a stacked bar plot
using bar.
import matplotlib.pyplot as plt
import numpy as np

# data from https://allisonhorst.github.io/palmerpenguins/

species = (
    "Adelie\n $\\mu=$3700.66g",
    "Chinstrap\n $\\mu=$3733.09g",
    "Gentoo\n $\\mu=5076.02g$",
)
weight_counts = {
    "Below": np.array([70, 31, 58]),
    "Above": np.array([82, 37, 66]),
}
width = 0.5

fig, ax = plt.subplots()
bottom = np.zeros(3)

for boolean, weight_count in weight_counts.items():
    p = ax.bar(species, weight_count, width, label=boolean, bottom=bottom)
    bottom += weight_count

ax.set_title("Number of penguins with above average body mass")
ax.legend(loc="upper right")

plt.show()