Note
Go to the end to download the full example code.
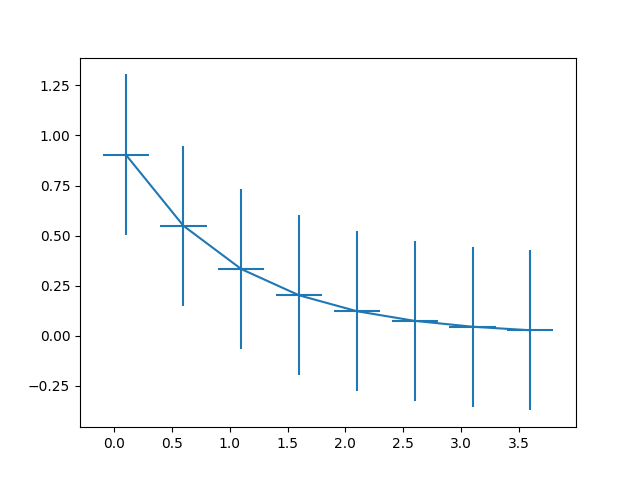
Errorbar function#
This exhibits the most basic use of the error bar method. In this case, constant values are provided for the error in both the x- and y-directions.
References
The use of the following functions, methods, classes and modules is shown in this example: