Note
Go to the end to download the full example code.
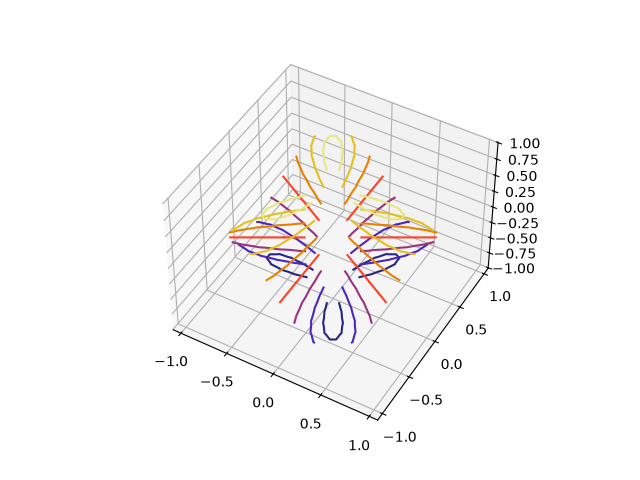
Triangular 3D contour plot#
Contour plots of unstructured triangular grids.
The data used is the same as in the second plot of More triangular 3D surfaces. Triangular 3D filled contour plot shows the filled version of this example.
import matplotlib.pyplot as plt
import numpy as np

import matplotlib.tri as tri

n_angles = 48
n_radii = 8
min_radius = 0.25

# Create the mesh in polar coordinates and compute x, y, z.
radii = np.linspace(min_radius, 0.95, n_radii)
angles = np.linspace(0, 2*np.pi, n_angles, endpoint=False)
angles = np.repeat(angles[..., np.newaxis], n_radii, axis=1)
angles[:, 1::2] += np.pi/n_angles

x = (radii*np.cos(angles)).flatten()
y = (radii*np.sin(angles)).flatten()
z = (np.cos(radii)*np.cos(3*angles)).flatten()

# Create a custom triangulation.
triang = tri.Triangulation(x, y)

# Mask off unwanted triangles.
triang.set_mask(np.hypot(x[triang.triangles].mean(axis=1),
                         y[triang.triangles].mean(axis=1))
                < min_radius)

ax = plt.figure().add_subplot(projection='3d')
ax.tricontour(triang, z, cmap="CMRmap")

# Customize the view angle so it's easier to understand the plot.
ax.view_init(elev=45.)

plt.show()