Note
Go to the end to download the full example code.
Building histograms using Rectangles and PolyCollections#
Using a path patch to draw rectangles.
The technique of using lots of Rectangle instances, or the faster method of
using PolyCollection, were implemented before we had proper paths with
moveto, lineto, closepoly, etc. in Matplotlib. Now that we have them, we can
draw collections of regularly shaped objects with homogeneous properties more
efficiently with a PathCollection. This example makes a histogram -- it's more
work to set up the vertex arrays at the outset, but it should be much faster
for large numbers of objects.
import matplotlib.pyplot as plt
import numpy as np
import matplotlib.patches as patches
import matplotlib.path as path
np.random.seed(19680801) # Fixing random state for reproducibility
# histogram our data with numpy
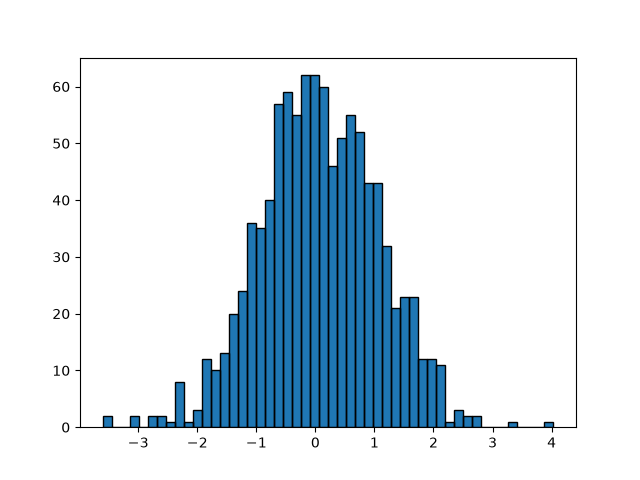
data = np.random.randn(1000)
n, bins = np.histogram(data, 50)
# get the corners of the rectangles for the histogram
left = bins[:-1]
right = bins[1:]
bottom = np.zeros(len(left))
top = bottom + n
# we need a (numrects x numsides x 2) numpy array for the path helper
# function to build a compound path
XY = np.array([[left, left, right, right], [bottom, top, top, bottom]]).T
# get the Path object
barpath = path.Path.make_compound_path_from_polys(XY)
# make a patch out of it, don't add a margin at y=0
patch = patches.PathPatch(barpath)
patch.sticky_edges.y[:] = [0]
fig, ax = plt.subplots()
ax.add_patch(patch)
ax.autoscale_view()
plt.show()
Instead of creating a three-dimensional array and using
make_compound_path_from_polys, we could as well create the
compound path directly using vertices and codes as shown below
nrects = len(left)
nverts = nrects*(1+3+1)
verts = np.zeros((nverts, 2))
codes = np.ones(nverts, int) * path.Path.LINETO
codes[0::5] = path.Path.MOVETO
codes[4::5] = path.Path.CLOSEPOLY
verts[0::5, 0] = left
verts[0::5, 1] = bottom
verts[1::5, 0] = left
verts[1::5, 1] = top
verts[2::5, 0] = right
verts[2::5, 1] = top
verts[3::5, 0] = right
verts[3::5, 1] = bottom

barpath = path.Path(verts, codes)

# make a patch out of it, don't add a margin at y=0
patch = patches.PathPatch(barpath)
patch.sticky_edges.y[:] = [0]

fig, ax = plt.subplots()
ax.add_patch(patch)
ax.autoscale_view()
plt.show()

References
The use of the following functions, methods, classes and modules is shown in this example:
This example shows an alternative to