Note
Go to the end to download the full example code.
Axes box aspect#
This demo shows how to set the aspect of an Axes box directly via
set_box_aspect. The box aspect is the ratio between Axes height
and Axes width in physical units, independent of the data limits.
This is useful to e.g. produce a square plot, independent of the data it
contains, or to have a usual plot with the same axes dimensions next to
an image plot with fixed (data-)aspect.
The following lists a few use cases for set_box_aspect.
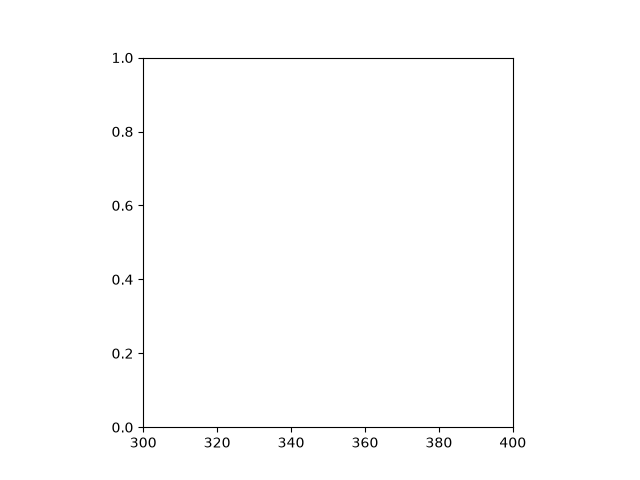
A square Axes, independent of data#
Produce a square Axes, no matter what the data limits are.
import matplotlib.pyplot as plt
import numpy as np

fig1, ax = plt.subplots()

ax.set_xlim(300, 400)
ax.set_box_aspect(1)

plt.show()
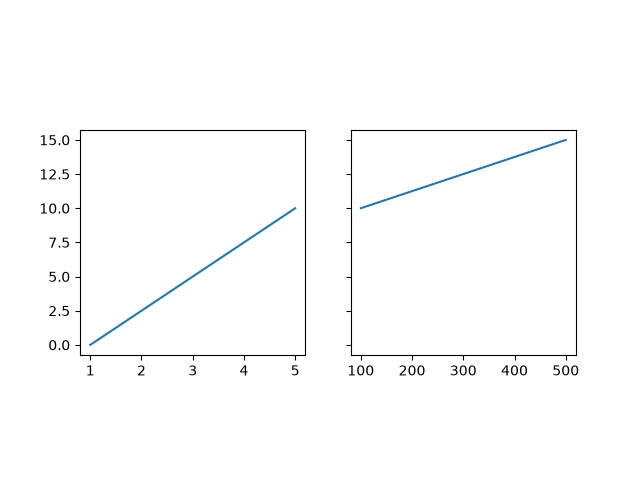
Shared square Axes#
Produce shared subplots that are squared in size.
fig2, (ax, ax2) = plt.subplots(ncols=2, sharey=True)

ax.plot([1, 5], [0, 10])
ax2.plot([100, 500], [10, 15])

ax.set_box_aspect(1)
ax2.set_box_aspect(1)

plt.show()
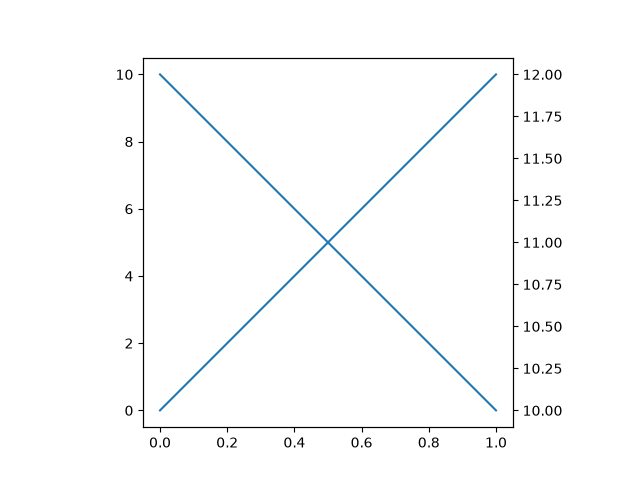
Square twin Axes#
Produce a square Axes, with a twin Axes. The twinned Axes takes over the box aspect of the parent.
fig3, ax = plt.subplots()

ax2 = ax.twinx()

ax.plot([0, 10])
ax2.plot([12, 10])

ax.set_box_aspect(1)

plt.show()
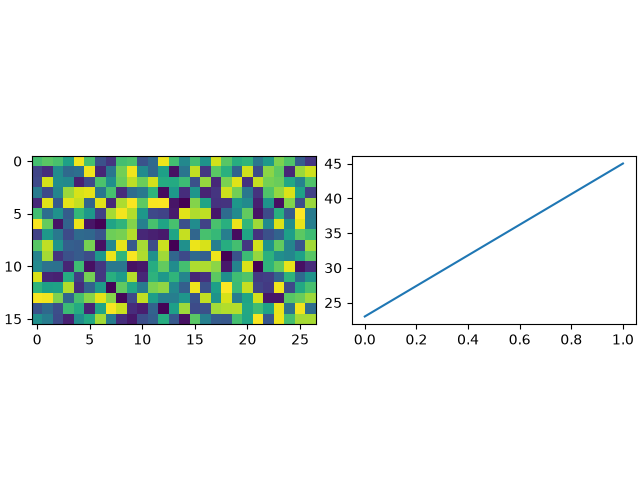
Normal plot next to image#
When creating an image plot with fixed data aspect and the default
adjustable="box" next to a normal plot, the Axes would be unequal in
height. set_box_aspect provides an easy solution to that by allowing
to have the normal plot's Axes use the images dimensions as box aspect.
This example also shows that constrained layout interplays nicely with a fixed box aspect.
fig4, (ax, ax2) = plt.subplots(ncols=2, layout="constrained")

np.random.seed(19680801)  # Fixing random state for reproducibility
im = np.random.rand(16, 27)
ax.imshow(im)

ax2.plot([23, 45])
ax2.set_box_aspect(im.shape[0]/im.shape[1])

plt.show()
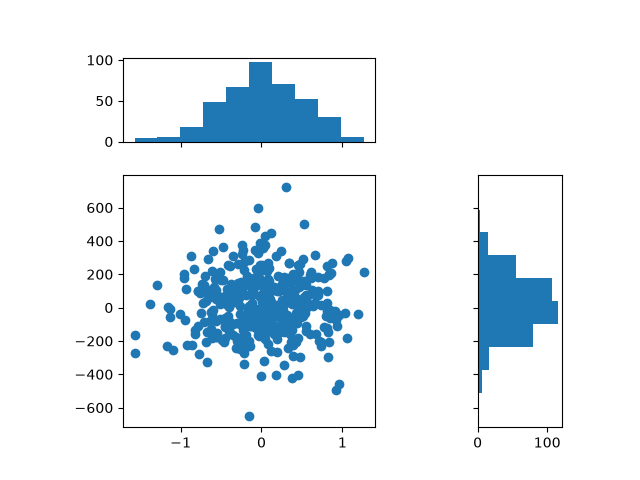
Square joint/marginal plot#
It may be desirable to show marginal distributions next to a plot of joint data. The following creates a square plot with the box aspect of the marginal Axes being equal to the width- and height-ratios of the gridspec. This ensures that all Axes align perfectly, independent on the size of the figure.
fig5, axs = plt.subplots(2, 2, sharex="col", sharey="row",
                         gridspec_kw=dict(height_ratios=[1, 3],
                                          width_ratios=[3, 1]))
axs[0, 1].set_visible(False)
axs[0, 0].set_box_aspect(1/3)
axs[1, 0].set_box_aspect(1)
axs[1, 1].set_box_aspect(3/1)

np.random.seed(19680801)  # Fixing random state for reproducibility
x, y = np.random.randn(2, 400) * [[.5], [180]]
axs[1, 0].scatter(x, y)
axs[0, 0].hist(x)
axs[1, 1].hist(y, orientation="horizontal")

plt.show()
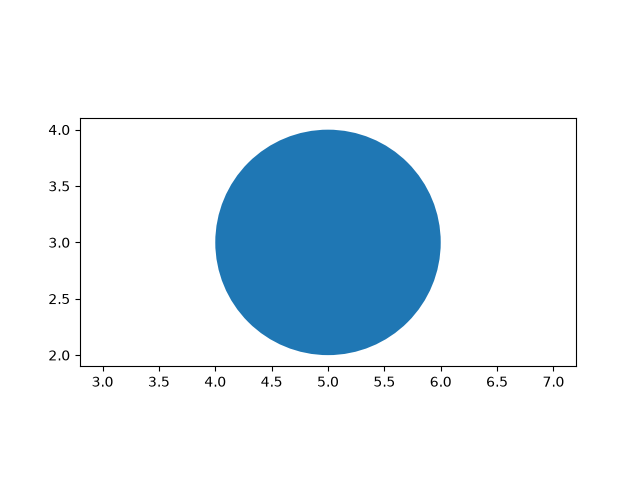
Set data aspect with box aspect#
When setting the box aspect, one may still set the data aspect as well. Here we create an Axes with a box twice as long as it is tall and use an "equal" data aspect for its contents, i.e. the circle actually stays circular.
fig6, ax = plt.subplots()

ax.add_patch(plt.Circle((5, 3), 1))
ax.set_aspect("equal", adjustable="datalim")
ax.set_box_aspect(0.5)
ax.autoscale()

plt.show()
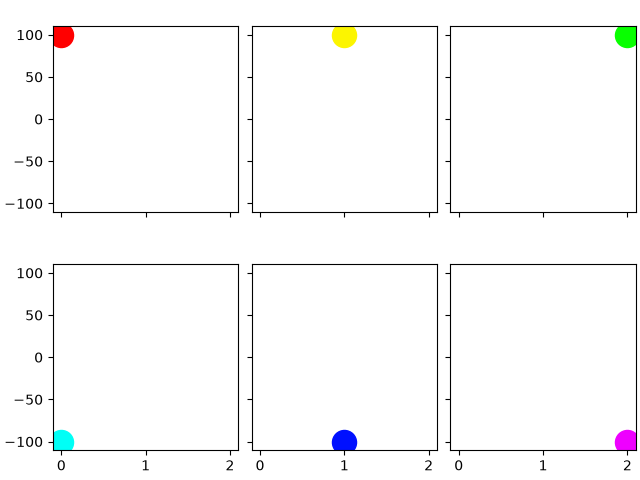
Box aspect for many subplots#
It is possible to pass the box aspect to an Axes at initialization. The following creates a 2 by 3 subplot grid with all square Axes.
fig7, axs = plt.subplots(2, 3, subplot_kw=dict(box_aspect=1),
                         sharex=True, sharey=True, layout="constrained")

for i, ax in enumerate(axs.flat):
    ax.scatter(i % 3, -((i // 3) - 0.5)*200, c=[plt.colormaps["hsv"](i / 6)], s=300)
plt.show()
References
The use of the following functions, methods, classes and modules is shown in this example:
Total running time of the script: (0 minutes 2.861 seconds)