Note
Go to the end to download the full example code.
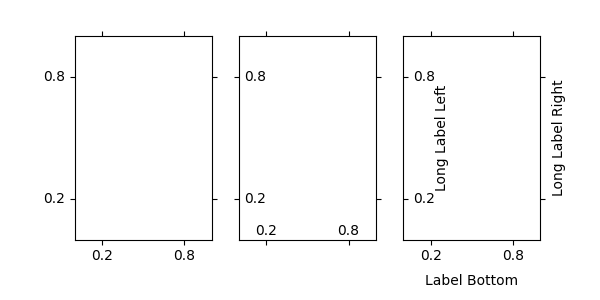
Ticklabel direction#
import matplotlib.pyplot as plt

import mpl_toolkits.axisartist.axislines as axislines


def setup_axes(fig, pos):
    ax = fig.add_subplot(pos, axes_class=axislines.Axes)
    ax.set_yticks([0.2, 0.8])
    ax.set_xticks([0.2, 0.8])
    return ax


fig = plt.figure(figsize=(6, 3))
fig.subplots_adjust(bottom=0.2)

ax = setup_axes(fig, 131)
for axis in ax.axis.values():
    axis.major_ticks.set_tick_out(True)
# or you can simply do "ax.axis[:].major_ticks.set_tick_out(True)"

ax = setup_axes(fig, 132)
ax.axis["left"].set_axis_direction("right")
ax.axis["bottom"].set_axis_direction("top")
ax.axis["right"].set_axis_direction("left")
ax.axis["top"].set_axis_direction("bottom")

ax = setup_axes(fig, 133)
ax.axis["left"].set_axis_direction("right")
ax.axis[:].major_ticks.set_tick_out(True)

ax.axis["left"].label.set_text("Long Label Left")
ax.axis["bottom"].label.set_text("Label Bottom")
ax.axis["right"].label.set_text("Long Label Right")
ax.axis["right"].label.set_visible(True)
ax.axis["left"].label.set_pad(0)
ax.axis["bottom"].label.set_pad(10)

plt.show()