Note
Go to the end to download the full example code.
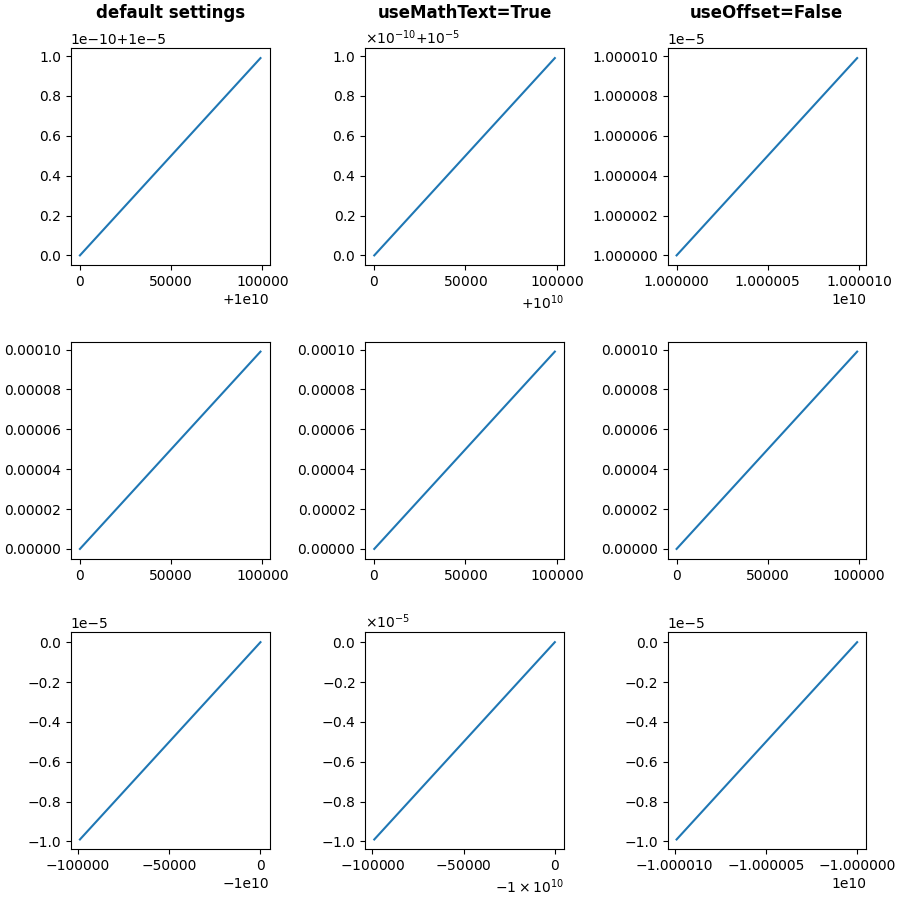
The default tick formatter#
By default, tick labels are formatted using a ScalarFormatter, which can be
configured via ticklabel_format. This example illustrates some
possible configurations:
Default.
useMathText=True: Fancy formatting of mathematical expressions.useOffset=False: Do not use offset notation; seeScalarFormatter.set_useOffset.
import matplotlib.pyplot as plt
import numpy as np

x = np.arange(0, 1, .01)
fig, axs = plt.subplots(
    3, 3, figsize=(9, 9), layout="constrained", gridspec_kw={"hspace": 0.1})

for col in axs.T:
    col[0].plot(x * 1e5 + 1e10, x * 1e-10 + 1e-5)
    col[1].plot(x * 1e5, x * 1e-4)
    col[2].plot(-x * 1e5 - 1e10, -x * 1e-5 - 1e-10)

for ax in axs[:, 1]:
    ax.ticklabel_format(useMathText=True)
for ax in axs[:, 2]:
    ax.ticklabel_format(useOffset=False)

plt.rcParams.update({"axes.titleweight": "bold", "axes.titley": 1.1})
axs[0, 0].set_title("default settings")
axs[0, 1].set_title("useMathText=True")
axs[0, 2].set_title("useOffset=False")

plt.show()
Total running time of the script: (0 minutes 2.265 seconds)