Note
Go to the end to download the full example code.
Plot multiple lines using a LineCollection#
Matplotlib can efficiently draw multiple lines at once using a LineCollection.
import matplotlib.pyplot as plt
import numpy as np

from matplotlib.collections import LineCollection

colors = ["indigo", "blue", "green", "yellow", "orange", "red"]

# create a list of half-circles with varying radii
theta = np.linspace(0, np.pi, 36)
radii = np.linspace(4, 5, num=len(colors))
arcs = [np.column_stack([r * np.cos(theta), r * np.sin(theta)]) for r in radii]

fig, ax = plt.subplots(figsize=(6.4, 3.2))
# set axes limits manually because Collections do not take part in autoscaling
ax.set_xlim(-6, 6)
ax.set_ylim(0, 6)
ax.set_aspect("equal")  # to make the arcs look circular

# create a LineCollection with the half-circles
# its properties can be set per line by passing a sequence (here used for *colors*)
# or they can be set for all lines by passing a scalar (here used for *linewidths*)
line_collection = LineCollection(arcs, colors=colors, linewidths=4)
ax.add_collection(line_collection)

plt.show()
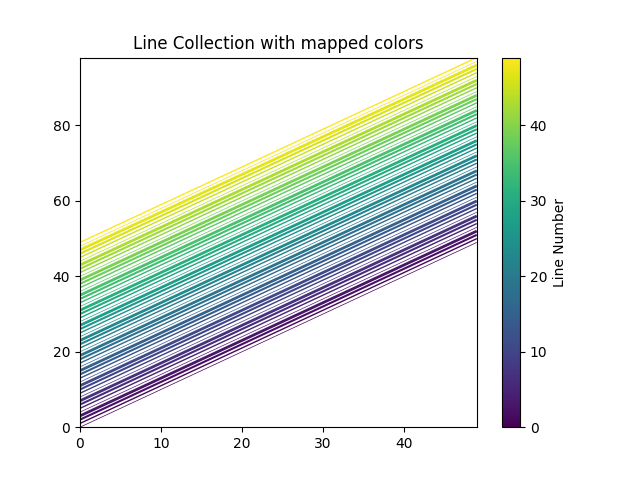
Instead of passing a list of colors (colors=colors), we can alternatively use
colormapping. The lines are then color-coded based on an additional array of values
passed to the array parameter. In the below example, we color the lines based on
their radius by passing array=radii.
num_arcs = 15
theta = np.linspace(0, np.pi, 36)
radii = np.linspace(4, 5.5, num=num_arcs)
arcs = [np.column_stack([r * np.cos(theta), r * np.sin(theta)]) for r in radii]

fig, ax = plt.subplots(figsize=(6.4, 3))
# set axes limits manually because Collections do not take part in autoscaling
ax.set_xlim(-6, 6)
ax.set_ylim(0, 6)
ax.set_aspect("equal")  # to make the arcs look circular

# create a LineCollection with the half-circles and color mapping
line_collection = LineCollection(arcs, array=radii, cmap="rainbow")
ax.add_collection(line_collection)

fig.colorbar(line_collection, label="Radius")
ax.set_title("Line Collection with mapped colors")

plt.show()
References
The use of the following functions, methods, classes and modules is shown in this example: