Note
Go to the end to download the full example code.
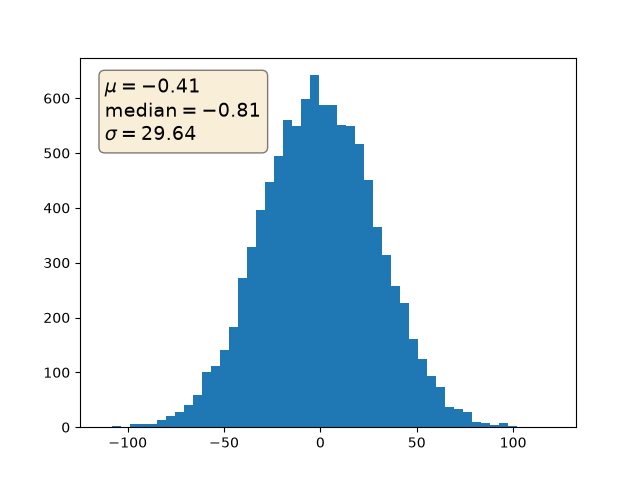
Placing text boxes#
When decorating Axes with text boxes, two useful tricks are to place the text
in axes coordinates (see Transformations Tutorial),
so the text doesn't move around with changes in x or y limits. You
can also use the bbox property of text to surround the text with a
Patch instance -- the bbox keyword argument takes a
dictionary with keys that are Patch properties.
import matplotlib.pyplot as plt
import numpy as np

np.random.seed(19680801)

fig, ax = plt.subplots()
x = 30*np.random.randn(10000)
mu = x.mean()
median = np.median(x)
sigma = x.std()
textstr = '\n'.join((
    r'$\mu=%.2f$' % (mu, ),
    r'$\mathrm{median}=%.2f$' % (median, ),
    r'$\sigma=%.2f$' % (sigma, )))

ax.hist(x, 50)
# these are matplotlib.patch.Patch properties
props = dict(boxstyle='round', facecolor='wheat', alpha=0.5)

# place a text box in upper left in axes coords
ax.text(0.05, 0.95, textstr, transform=ax.transAxes, fontsize=14,
        verticalalignment='top', bbox=props)

plt.show()