Note
Go to the end to download the full example code.
Title positioning#
Matplotlib can display plot titles centered, flush with the left side of a set of Axes, and flush with the right side of a set of Axes.
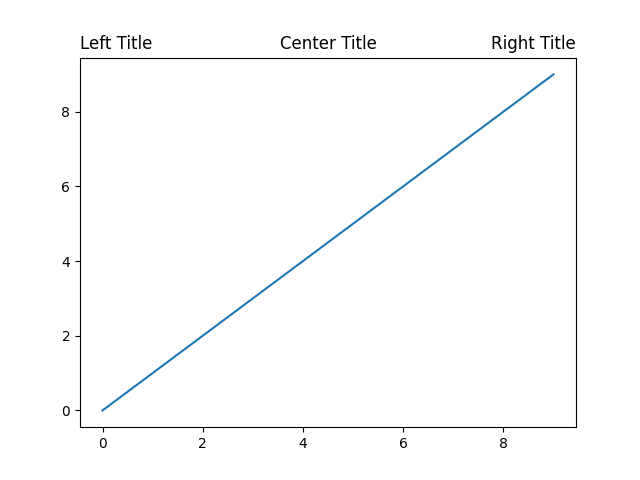
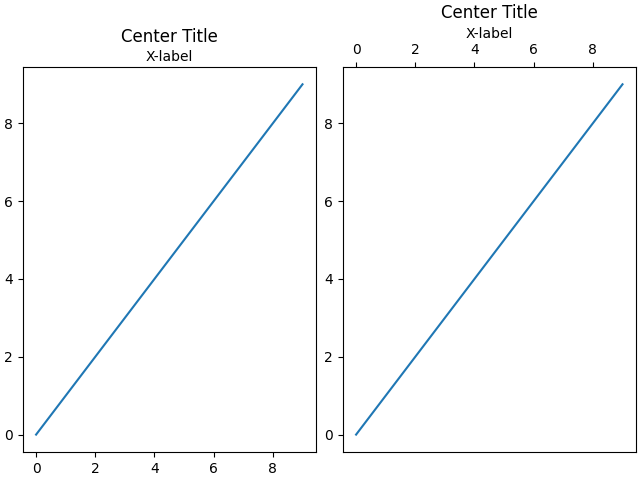
The vertical position is automatically chosen to avoid decorations (i.e. labels and ticks) on the topmost x-axis:
fig, axs = plt.subplots(1, 2, layout='constrained')

ax = axs[0]
ax.plot(range(10))
ax.xaxis.set_label_position('top')
ax.set_xlabel('X-label')
ax.set_title('Center Title')

ax = axs[1]
ax.plot(range(10))
ax.xaxis.set_label_position('top')
ax.xaxis.tick_top()
ax.set_xlabel('X-label')
ax.set_title('Center Title')
plt.show()
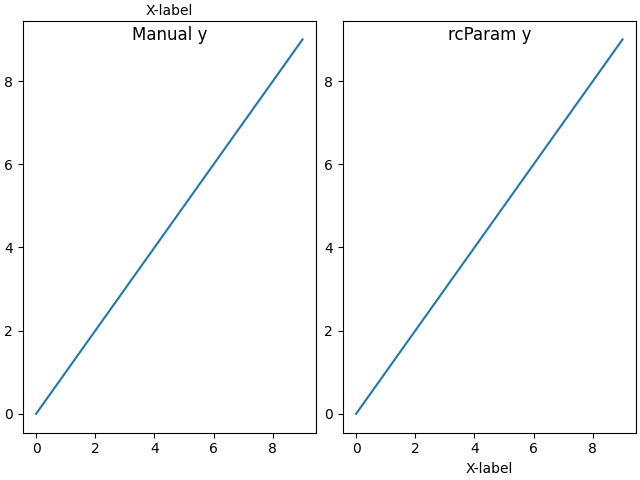
Automatic positioning can be turned off by manually specifying the y
keyword argument for the title or setting rcParams["axes.titley"] (default: None) in the rcParams.
fig, axs = plt.subplots(1, 2, layout='constrained')

ax = axs[0]
ax.plot(range(10))
ax.xaxis.set_label_position('top')
ax.set_xlabel('X-label')
ax.set_title('Manual y', y=1.0, pad=-14)

plt.rcParams['axes.titley'] = 1.0    # y is in axes-relative coordinates.
plt.rcParams['axes.titlepad'] = -14  # pad is in points...
ax = axs[1]
ax.plot(range(10))
ax.set_xlabel('X-label')
ax.set_title('rcParam y')

plt.show()
Total running time of the script: (0 minutes 1.128 seconds)