Note
Go to the end to download the full example code.
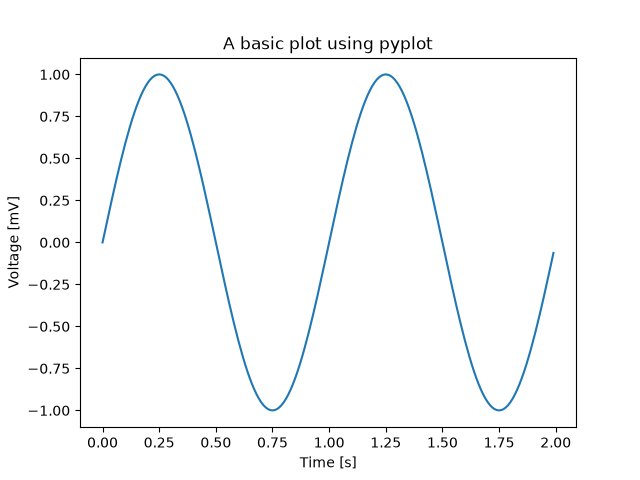
Basic plot#
A basic plot using the The implicit "pyplot" interface.
plotplots the data y versus x as lines and/or markers.title,xlabelandylabelset the title, x-axis label and y-axis label.showdisplays the plot.
References
The use of the following functions, methods, classes and modules is shown in this example: