Note
Go to the end to download the full example code.
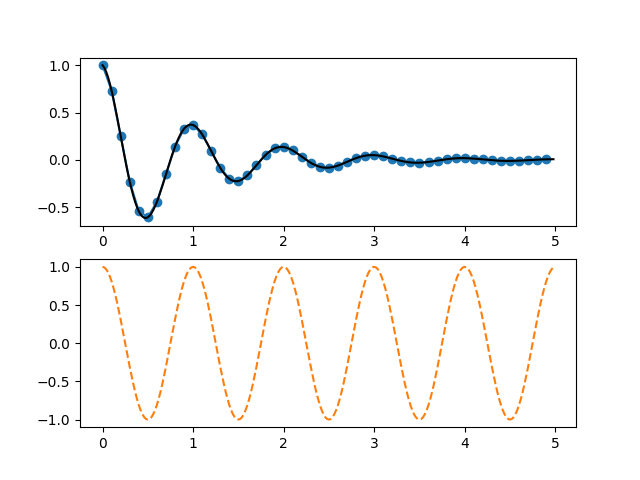
Two subplots using pyplot#
A typical pyplot usage pattern is to create subplots incrementally through
subplot.
The three-digit number passed to subplot specifies the position of
the subplot in the grid of subplots. 211 means "in a grid of 2 rows and 1 column,
create this subplot in the 1st position". 212 likewise means "in a grid of 2
rows and 1 column, create this subplot in the 2nd position".
After calling subplot() all following pyplot commands will modify that subplot
until a new subplot is created.
import matplotlib.pyplot as plt
import numpy as np


def f(t):
    return np.exp(-t) * np.cos(2*np.pi*t)


t1 = np.arange(0.0, 5.0, 0.1)
t2 = np.arange(0.0, 5.0, 0.02)

plt.figure()
plt.subplot(211)
plt.plot(t1, f(t1), color='tab:blue', marker='o')
plt.plot(t2, f(t2), color='black')
plt.title("Subplot 1")

plt.subplot(212)
plt.plot(t2, np.cos(2*np.pi*t2), color='tab:orange', linestyle='--')
plt.title("Subplot 2")
plt.show()
References
The use of the following functions, methods, classes and modules is shown in this example: