Note
Go to the end to download the full example code.
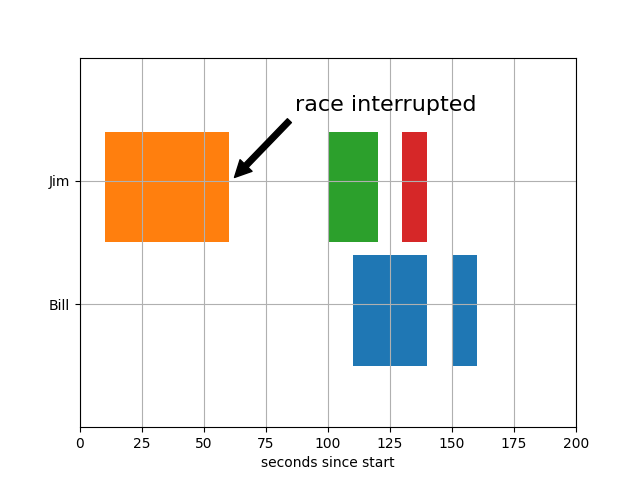
Broken horizontal bars#
broken_barh creates sequences of horizontal bars. This example shows
a timing diagram.
import matplotlib.pyplot as plt
import numpy as np

# data is a sequence of (start, duration) tuples
cpu_1 = [(0, 3), (3.5, 1), (5, 5)]
cpu_2 = np.column_stack([np.linspace(0, 9, 10), np.full(10, 0.5)])
cpu_3 = np.column_stack([10*np.random.random(61), np.full(61, 0.05)])
cpu_4 = [(2, 1.7), (7, 1.2)]
disk = [(1, 1.5)]
network = np.column_stack([10*np.random.random(10), np.full(10, 0.05)])

fig, ax = plt.subplots()
# broken_barh(xranges, (ypos, height))
ax.broken_barh(cpu_1, ("CPU 1", 0.4), align="center")
ax.broken_barh(cpu_2, ("CPU 2", 0.4), align="center")
ax.broken_barh(cpu_3, ("CPU 3", 0.4), align="center")
ax.broken_barh(cpu_4, ("CPU 4", 0.4), align="center")
ax.broken_barh(disk, ("disk", 0.4), align="center", color="tab:orange")
ax.broken_barh(network, ("network", 0.4), align="center", color="tab:green")
ax.set_xlim(0, 10)
ax.invert_yaxis()  # order the bars from top to bottom
ax.set_title("Resource usage")

plt.show()
References
The use of the following functions, methods, classes and modules is shown in this example: