matplotlib.axes.Axes.annotate#
- Axes.annotate(text, xy, xytext=None, xycoords='data', textcoords=None, arrowprops=None, annotation_clip=None, **kwargs)[source]#
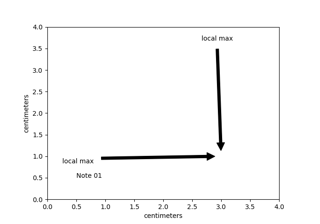
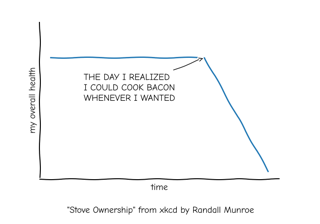
Annotate the point xy with text text.
In the simplest form, the text is placed at xy.
Optionally, the text can be displayed in another position xytext. An arrow pointing from the text to the annotated point xy can then be added by defining arrowprops.
- Parameters:
- textstr
The text of the annotation.
- xy(float, float)
The point (x, y) to annotate. The coordinate system is determined by xycoords.
- xytext(float, float), default: xy
The position (x, y) to place the text at. The coordinate system is determined by textcoords.
- xycoordssingle or two-tuple of str or
ArtistorTransformor callable, default: 'data' The coordinate system that xy is given in. The following types of values are supported:
One of the following strings:
Value
Description
'figure points'
Points from the lower left of the figure
'figure pixels'
Pixels from the lower left of the figure
'figure fraction'
Fraction of figure from lower left
'subfigure points'
Points from the lower left of the subfigure
'subfigure pixels'
Pixels from the lower left of the subfigure
'subfigure fraction'
Fraction of subfigure from lower left
'axes points'
Points from lower left corner of the Axes
'axes pixels'
Pixels from lower left corner of the Axes
'axes fraction'
Fraction of Axes from lower left
'data'
Use the coordinate system of the object being annotated (default)
'polar'
(theta, r) if not native 'data' coordinates
Note that 'subfigure pixels' and 'figure pixels' are the same for the parent figure, so users who want code that is usable in a subfigure can use 'subfigure pixels'.
An
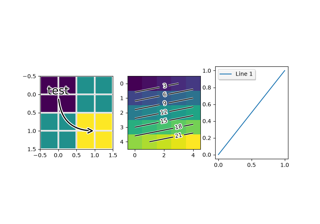
Artist: xy is interpreted as a fraction of the artist'sBbox. E.g. (0, 0) would be the lower left corner of the bounding box and (0.5, 1) would be the center top of the bounding box.A
Transformto transform xy to screen coordinates.A function with one of the following signatures:
def transform(renderer) -> Bbox
def transform(renderer) -> Transform
where renderer is a
RendererBasesubclass.The result of the function is interpreted like the
ArtistandTransformcases above.A tuple (xcoords, ycoords) specifying separate coordinate systems for x and y. xcoords and ycoords must each be of one of the above described types.
See Advanced annotation for more details.
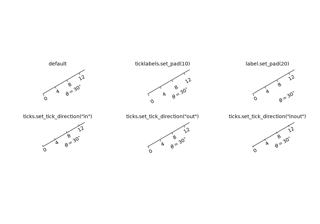
- textcoordssingle or two-tuple of str or
ArtistorTransformor callable, default: value of xycoords The coordinate system that xytext is given in.
All xycoords values are valid as well as the following strings:
Value
Description
'offset points'
Offset, in points, from the xy value
'offset pixels'
Offset, in pixels, from the xy value
'offset fontsize'
Offset, relative to fontsize, from the xy value
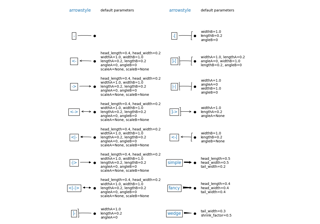
- arrowpropsdict, optional
The properties used to draw a
FancyArrowPatcharrow between the positions xy and xytext. Defaults to None, i.e. no arrow is drawn.For historical reasons there are two different ways to specify arrows, "simple" and "fancy":
Simple arrow:
If arrowprops does not contain the key 'arrowstyle' the allowed keys are:
Key
Description
width
The width of the arrow in points
headwidth
The width of the base of the arrow head in points
headlength
The length of the arrow head in points
shrink
Fraction of total length to shrink from both ends
?
Any
FancyArrowPatchpropertyThe arrow is attached to the edge of the text box, the exact position (corners or centers) depending on where it's pointing to.
Fancy arrow:
This is used if 'arrowstyle' is provided in the arrowprops.
Valid keys are the following
FancyArrowPatchparameters:Key
Description
arrowstyle
The arrow style
connectionstyle
The connection style
relpos
See below; default is (0.5, 0.5)
patchA
Default is bounding box of the text
patchB
Default is None
shrinkA
In points. Default is 2 points
shrinkB
In points. Default is 2 points
mutation_scale
Default is text size (in points)
mutation_aspect
Default is 1
?
Any
FancyArrowPatchpropertyThe exact starting point position of the arrow is defined by relpos. It's a tuple of relative coordinates of the text box, where (0, 0) is the lower left corner and (1, 1) is the upper right corner. Values <0 and >1 are supported and specify points outside the text box. By default (0.5, 0.5), so the starting point is centered in the text box.
- annotation_clipbool or None, default: None
Whether to clip (i.e. not draw) the annotation when the annotation point xy is outside the Axes area.
If True, the annotation will be clipped when xy is outside the Axes.
If False, the annotation will always be drawn.
If None, the annotation will be clipped when xy is outside the Axes and xycoords is 'data'.
- **kwargs
Additional kwargs are passed to
Text.
- Returns:
See also
Examples using matplotlib.axes.Axes.annotate#


Concatenate text objects with different properties