mpl_toolkits.mplot3d.axes3d.Axes3D.stem#
- Axes3D.stem(x, y, z, *, linefmt='C0-', markerfmt='C0o', basefmt='C3-', bottom=0, label=None, orientation='z', axlim_clip=False, data=None)[source]#
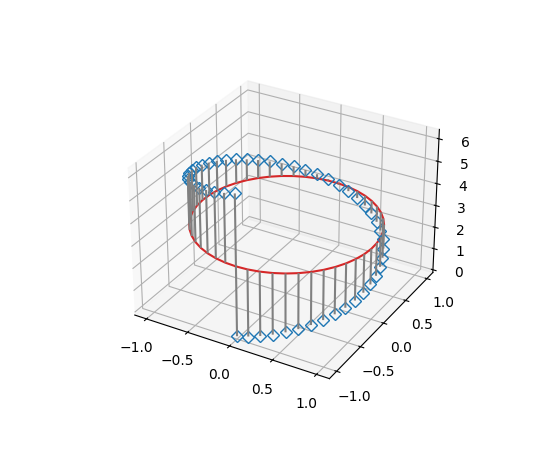
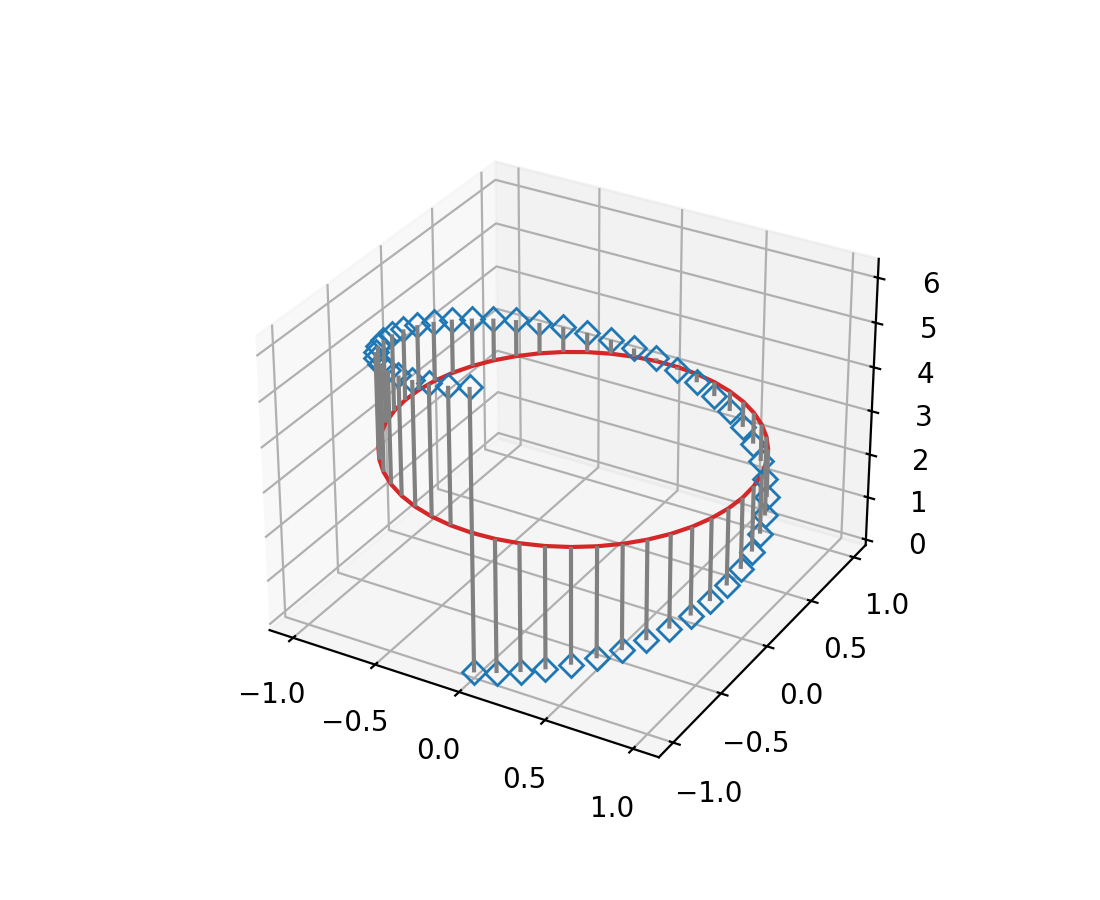
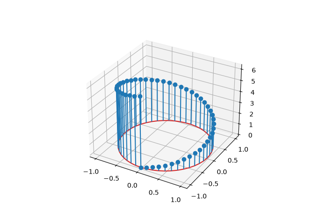
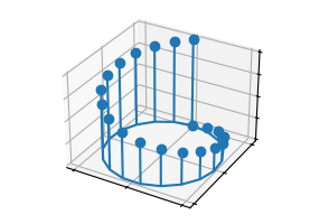
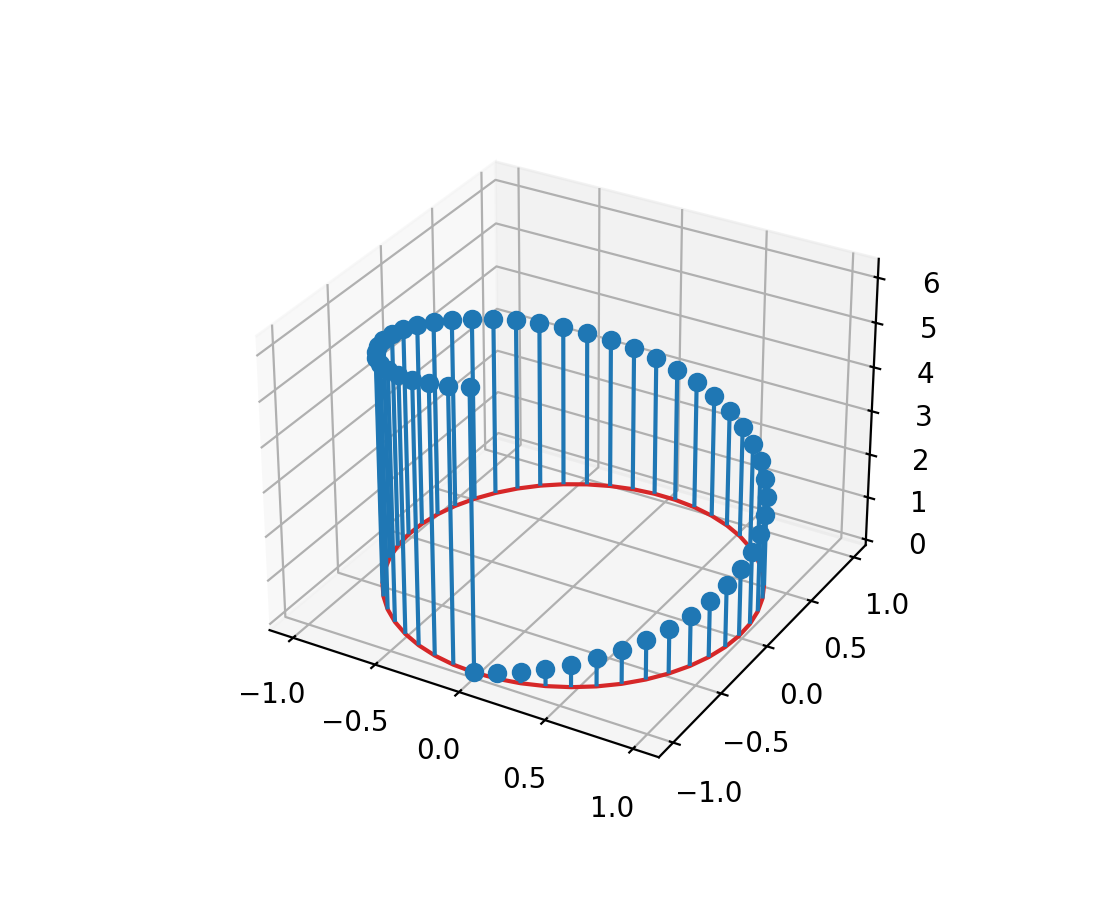
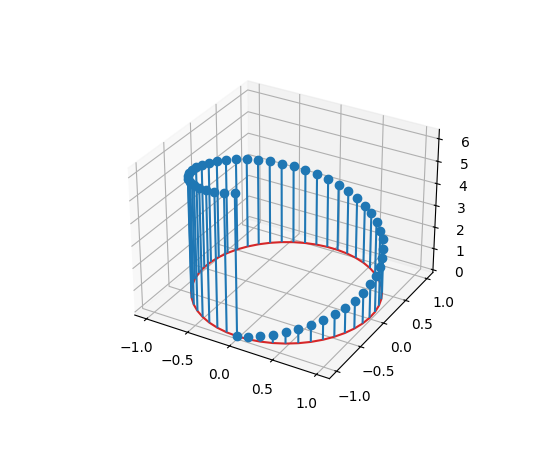
Create a 3D stem plot.
A stem plot draws lines perpendicular to a baseline, and places markers at the heads. By default, the baseline is defined by x and y, and stems are drawn vertically from bottom to z.
- Parameters:
- x, y, zarray-like
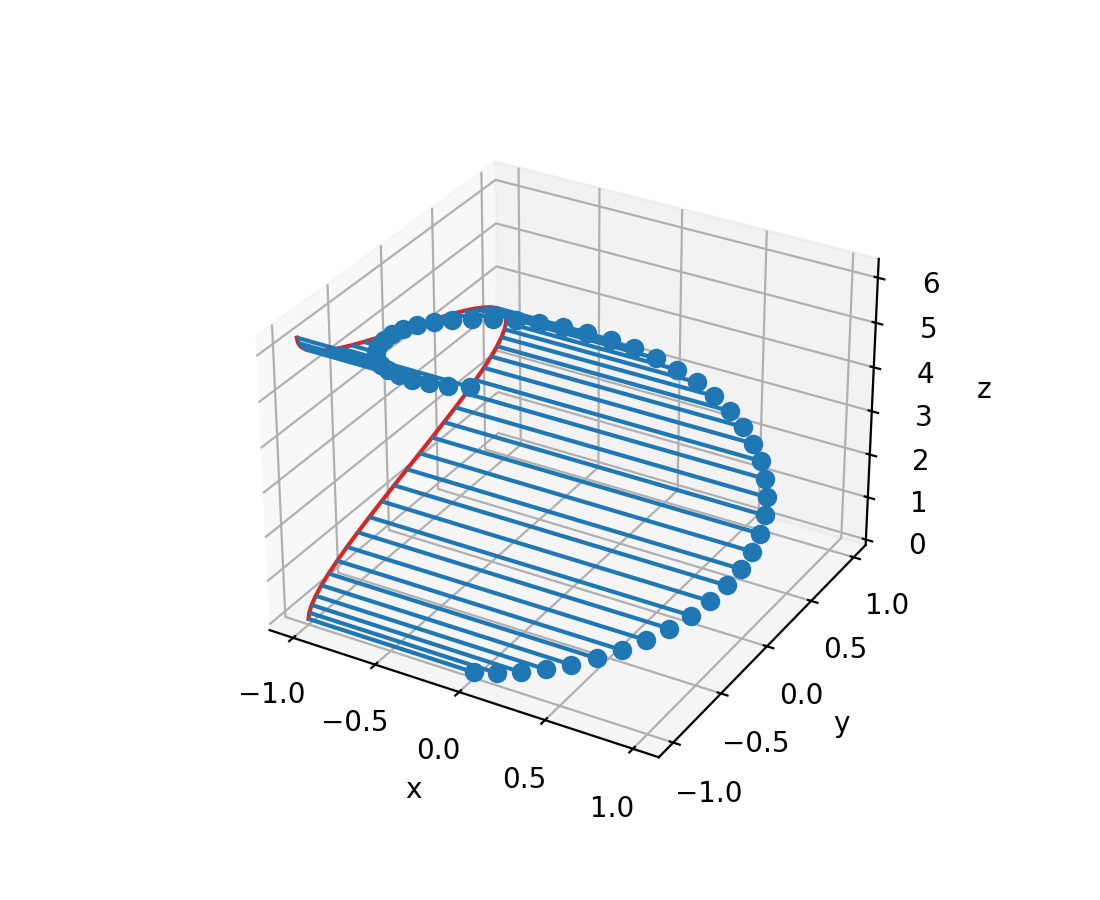
The positions of the heads of the stems. The stems are drawn along the orientation-direction from the baseline at bottom (in the orientation-coordinate) to the heads. By default, the x and y positions are used for the baseline and z for the head position, but this can be changed by orientation.
- linefmtstr, default: 'C0-'
A string defining the properties of the vertical lines. Usually, this will be a color or a color and a linestyle:
Character
Line Style
'-'solid line
'--'dashed line
'-.'dash-dot line
':'dotted line
Note: While it is technically possible to specify valid formats other than color or color and linestyle (e.g. 'rx' or '-.'), this is beyond the intention of the method and will most likely not result in a reasonable plot.
- markerfmtstr, default: 'C0o'
A string defining the properties of the markers at the stem heads.
- basefmtstr, default: 'C3-'
A format string defining the properties of the baseline.
- bottomfloat, default: 0
The position of the baseline, in orientation-coordinates.
- labelstr, optional
The label to use for the stems in legends.
- orientation{'x', 'y', 'z'}, default: 'z'
The direction along which stems are drawn.
- axlim_clipbool, default: False
Whether to hide stems that are outside the axes limits.
Added in version 3.10.
- dataindexable object, optional
If given, all parameters also accept a string
s, which is interpreted asdata[s]ifsis a key indata.
- Returns:
StemContainerThe container may be treated like a tuple (markerline, stemlines, baseline)
Examples
(
Source code,2x.png,png)

