matplotlib.axes.Axes.axvline#
- Axes.axvline(x=0, ymin=0, ymax=1, **kwargs)[source]#
Add a vertical line spanning the whole or fraction of the Axes.
Note: If you want to set y-limits in data coordinates, use
vlinesinstead.- Parameters:
- xfloat, default: 0
x position in data coordinates.
- yminfloat, default: 0
The start y-position in axes coordinates. Should be between 0 and 1, 0 being the bottom of the plot, 1 the top of the plot.
- ymaxfloat, default: 1
The end y-position in axes coordinates. Should be between 0 and 1, 0 being the bottom of the plot, 1 the top of the plot.
- Returns:
Line2DA
Line2Dspecified via two points(x, ymin),(x, ymax). Its transform is set such that x is in data coordinates and y is in axes coordinates.This is still a generic line and the vertical character is only realized through using identical x values for both points. Thus, if you want to change the x value later, you have to provide two values
line.set_xdata([3, 3]).
- Other Parameters:
- **kwargs
Valid keyword arguments are
Line2Dproperties, except for 'transform':Property
Description
a filter function, which takes a (m, n, 3) float array and a dpi value, and returns a (m, n, 3) array and two offsets from the bottom left corner of the image
float or None
bool
antialiasedoraabool
BboxBaseor Nonebool
Patch or (Path, Transform) or None
CapStyleor {'butt', 'projecting', 'round'}JoinStyleor {'miter', 'round', 'bevel'}sequence of floats (on/off ink in points) or (None, None)
(2, N) array or two 1D arrays
{'default', 'steps', 'steps-pre', 'steps-mid', 'steps-post'}, default: 'default'
{'full', 'left', 'right', 'bottom', 'top', 'none'}
color or None
str
bool
object
{'-', '--', '-.', ':', '', ...} or (offset, on-off-seq)
float
marker style string,
PathorMarkerStylefloat
markersizeormsfloat
None or int or (int, int) or slice or list[int] or float or (float, float) or list[bool]
bool
list of
AbstractPathEffectfloat or callable[[Artist, Event], tuple[bool, dict]]
float
bool
(scale: float, length: float, randomness: float)
bool or None
CapStyleor {'butt', 'projecting', 'round'}JoinStyleor {'miter', 'round', 'bevel'}unknown
str
bool
1D array
1D array
float
See also
Examples
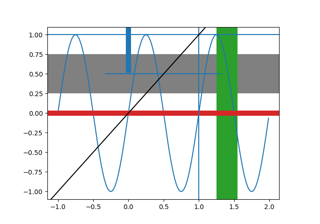
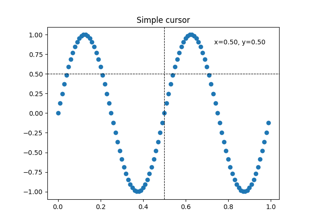
draw a thick red vline at x = 0 that spans the yrange:
>>> axvline(linewidth=4, color='r')
draw a default vline at x = 1 that spans the yrange:
>>> axvline(x=1)
draw a default vline at x = .5 that spans the middle half of the yrange:
>>> axvline(x=.5, ymin=0.25, ymax=0.75)
Examples using matplotlib.axes.Axes.axvline#

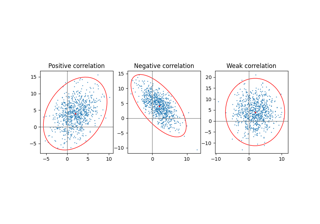
Plot a confidence ellipse of a two-dimensional dataset
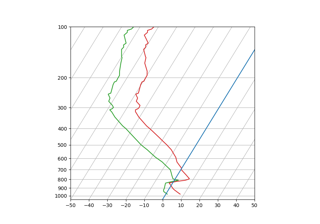
SkewT-logP diagram: using transforms and custom projections