matplotlib.axes.Axes.triplot#
- Axes.triplot(*args, **kwargs)[source]#
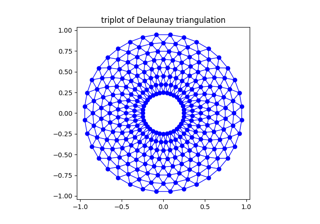
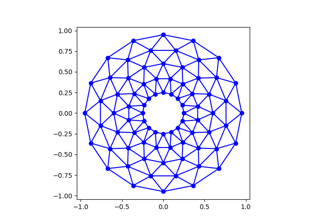
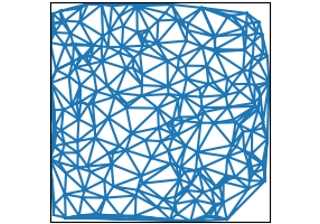
Draw an unstructured triangular grid as lines and/or markers.
Call signatures:
triplot(triangulation, ...)
triplot(x, y, [triangles], *, [mask=mask], ...)
The triangular grid can be specified either by passing a
Triangulationobject as the first parameter, or by passing the points x, y and optionally the triangles and a mask. If neither of triangulation or triangles are given, the triangulation is calculated on the fly.- Parameters:
- triangulation
Triangulation An already created triangular grid.
- x, y, triangles, mask
Parameters defining the triangular grid. See
Triangulation. This is mutually exclusive with specifying triangulation.- other_parameters
All other args and kwargs are forwarded to
plot.
- triangulation
- Returns: