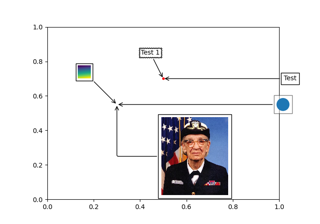
matplotlib.patches.ConnectionPatch#
- class matplotlib.patches.ConnectionPatch(xyA, xyB, coordsA, coordsB=None, *, axesA=None, axesB=None, arrowstyle='-', connectionstyle='arc3', patchA=None, patchB=None, shrinkA=0.0, shrinkB=0.0, mutation_scale=10.0, mutation_aspect=None, clip_on=False, **kwargs)[source]#
Bases:
FancyArrowPatchA patch that connects two points (possibly in different Axes).
Connect point xyA in coordsA with point xyB in coordsB.
Valid keys are
Key
Description
arrowstyle
the arrow style
connectionstyle
the connection style
relpos
default is (0.5, 0.5)
patchA
default is bounding box of the text
patchB
default is None
shrinkA
default is 2 points
shrinkB
default is 2 points
mutation_scale
default is text size (in points)
mutation_aspect
default is 1.
?
any key for
matplotlib.patches.PathPatchcoordsA and coordsB are strings that indicate the coordinates of xyA and xyB.
Property
Description
'figure points'
points from the lower left corner of the figure
'figure pixels'
pixels from the lower left corner of the figure
'figure fraction'
0, 0 is lower left of figure and 1, 1 is upper right
'subfigure points'
points from the lower left corner of the subfigure
'subfigure pixels'
pixels from the lower left corner of the subfigure
'subfigure fraction'
fraction of the subfigure, 0, 0 is lower left.
'axes points'
points from lower left corner of the Axes
'axes pixels'
pixels from lower left corner of the Axes
'axes fraction'
0, 0 is lower left of Axes and 1, 1 is upper right
'data'
use the coordinate system of the object being annotated (default)
'offset points'
offset (in points) from the xy value
'polar'
you can specify theta, r for the annotation, even in cartesian plots. Note that if you are using a polar Axes, you do not need to specify polar for the coordinate system since that is the native "data" coordinate system.
Alternatively they can be set to any valid
Transform.Note that 'subfigure pixels' and 'figure pixels' are the same for the parent figure, so users who want code that is usable in a subfigure can use 'subfigure pixels'.
Note
Using
ConnectionPatchacross twoAxesinstances is not directly compatible with constrained layout. Add the artist directly to theFigureinstead of adding it to a specific Axes, or exclude it from the layout usingcon.set_in_layout(False).fig, ax = plt.subplots(1, 2, constrained_layout=True) con = ConnectionPatch(..., axesA=ax[0], axesB=ax[1]) fig.add_artist(con)
- draw(renderer)[source]#
Draw the Artist (and its children) using the given renderer.
This has no effect if the artist is not visible (
Artist.get_visiblereturns False).- Parameters:
- renderer
RendererBasesubclass.
- renderer
Notes
This method is overridden in the Artist subclasses.
- get_annotation_clip()[source]#
Return the clipping behavior.
See
set_annotation_clipfor the meaning of the return value.
- set(*, agg_filter=<UNSET>, alpha=<UNSET>, animated=<UNSET>, annotation_clip=<UNSET>, antialiased=<UNSET>, arrowstyle=<UNSET>, capstyle=<UNSET>, clip_box=<UNSET>, clip_on=<UNSET>, clip_path=<UNSET>, color=<UNSET>, connectionstyle=<UNSET>, edgecolor=<UNSET>, edgegapcolor=<UNSET>, facecolor=<UNSET>, fill=<UNSET>, gid=<UNSET>, hatch=<UNSET>, hatch_linewidth=<UNSET>, hatchcolor=<UNSET>, in_layout=<UNSET>, joinstyle=<UNSET>, label=<UNSET>, linestyle=<UNSET>, linewidth=<UNSET>, mouseover=<UNSET>, mutation_aspect=<UNSET>, mutation_scale=<UNSET>, patchA=<UNSET>, patchB=<UNSET>, path_effects=<UNSET>, picker=<UNSET>, positions=<UNSET>, rasterized=<UNSET>, sketch_params=<UNSET>, snap=<UNSET>, transform=<UNSET>, url=<UNSET>, visible=<UNSET>, zorder=<UNSET>)[source]#
Set multiple properties at once.
a.set(a=A, b=B, c=C)
is equivalent to
a.set_a(A)
a.set_b(B)
a.set_c(C)
In addition to the full property names, aliases are also supported, e.g.
set(lw=2)is equivalent toset(linewidth=2), but it is an error to pass both simultaneously.The order of the individual setter calls matches the order of parameters in
set(). However, most properties do not depend on each other so that order is rarely relevant.Supported properties are
Property
Description
a filter function, which takes a (m, n, 3) float array and a dpi value, and returns a (m, n, 3) array and two offsets from the bottom left corner of the image
float or None
bool
bool or None
antialiasedoraabool or None
[ '-' | '<-' | '->' | '<->' | '<|-' | '-|>' | '<|-|>' | ']-' | '-[' | ']-[' | '|-|' | ']->' | '<-[' | 'simple' | 'fancy' | 'wedge' ]
CapStyleor {'butt', 'projecting', 'round'}BboxBaseor Nonebool
Patch or (Path, Transform) or None
[ 'arc3' | 'angle3' | 'angle' | 'arc' | 'bar' ]
color or None
color or None
color or None
bool
str
{'/', '\', '|', '-', '+', 'x', 'o', 'O', '.', '*'}
unknown
color or 'edge' or None
bool
JoinStyleor {'miter', 'round', 'bevel'}object
{'-', '--', '-.', ':', '', ...} or (offset, on-off-seq)
float or None
bool
float
float
list of
AbstractPathEffectNone or bool or float or callable
unknown
bool
(scale: float, length: float, randomness: float)
bool or None
str
bool
float
- set_annotation_clip(b)[source]#
Set the annotation's clipping behavior.
- Parameters:
- bbool or None
True: The annotation will be clipped when
self.xyis outside the Axes.False: The annotation will always be drawn.
None: The annotation will be clipped when
self.xyis outside the Axes andself.xycoords == "data".