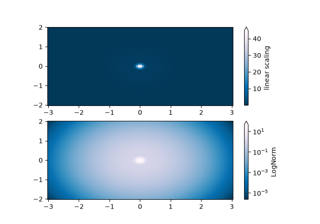
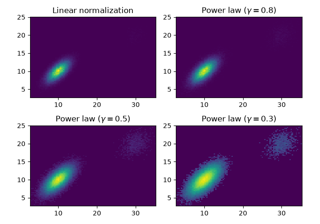
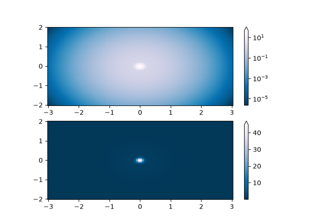
matplotlib.colors.PowerNorm#
- class matplotlib.colors.PowerNorm(gamma, vmin=None, vmax=None, clip=False)[source]#
Bases:
NormalizeLinearly map a given value to the 0-1 range and then apply a power-law normalization over that range.
- Parameters:
- gammafloat
Power law exponent.
- vmin, vmaxfloat or None
If vmin and/or vmax is not given, they are initialized from the minimum and maximum value, respectively, of the first input processed; i.e.,
__call__(A)callsautoscale_None(A).- clipbool, default: False
Determines the behavior for mapping values outside the range
[vmin, vmax].If clipping is off, values above vmax are transformed by the power function, resulting in values above 1, and values below vmin are linearly transformed resulting in values below 0. This behavior is usually desirable, as colormaps can mark these under and over values with specific colors.
If clipping is on, values below vmin are mapped to 0 and values above vmax are mapped to 1. Such values become indistinguishable from regular boundary values, which may cause misinterpretation of the data.
Notes
The normalization formula is
\[\left ( \frac{x - v_{min}}{v_{max} - v_{min}} \right )^{\gamma}\]For input values below vmin, gamma is set to one.
- Parameters:
- vmin, vmaxfloat or None
Values within the range
[vmin, vmax]from the input data will be linearly mapped to[0, 1]. If either vmin or vmax is not provided, they default to the minimum and maximum values of the input, respectively.- clipbool, default: False
Determines the behavior for mapping values outside the range
[vmin, vmax].If clipping is off, values outside the range
[vmin, vmax]are also transformed, resulting in values outside[0, 1]. This behavior is usually desirable, as colormaps can mark these under and over values with specific colors.If clipping is on, values below vmin are mapped to 0 and values above vmax are mapped to 1. Such values become indistinguishable from regular boundary values, which may cause misinterpretation of the data.
Notes
If
vmin == vmax, input data will be mapped to 0.- __call__(value, clip=None)[source]#
Normalize the data and return the normalized data.
- Parameters:
- value
Data to normalize.
- clipbool, optional
See the description of the parameter clip in
Normalize.If
None, defaults toself.clip(which defaults toFalse).
Notes
If not already initialized,
self.vminandself.vmaxare initialized usingself.autoscale_None(value).