mpl_toolkits.axes_grid1.axes_divider.AxesDivider#
- class mpl_toolkits.axes_grid1.axes_divider.AxesDivider(axes, xref=None, yref=None)[source]#
Bases:
DividerDivider based on the preexisting axes.
- Parameters:
- axes
Axes - xref
- yref
- axes
- append_axes(position, size, pad=None, *, axes_class=None, **kwargs)[source]#
Add a new axes on a given side of the main axes.
- Parameters:
- position{"left", "right", "bottom", "top"}
Where the new axes is positioned relative to the main axes.
- size
axes_sizeor float or str The axes width or height. float or str arguments are interpreted as
axes_size.from_any(size, AxesX(<main_axes>))for left or right axes, and likewise withAxesYfor bottom or top axes.- pad
axes_sizeor float or str Padding between the axes. float or str arguments are interpreted as for size. Defaults to
rcParams["figure.subplot.wspace"](default:0.2) times the main Axes width (left or right axes) orrcParams["figure.subplot.hspace"](default:0.2) times the main Axes height (bottom or top axes).- axes_classsubclass type of
Axes, optional The type of the new axes. Defaults to the type of the main axes.
- **kwargs
All extra keywords arguments are passed to the created axes.
Examples using mpl_toolkits.axes_grid1.axes_divider.AxesDivider#
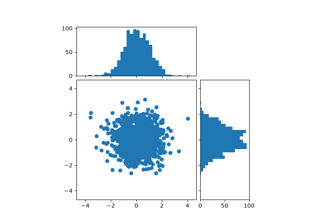
Align histogram to scatter plot using locatable Axes
