matplotlib.axes.Axes.tricontourf#
- Axes.tricontourf(*args, **kwargs)[source]#
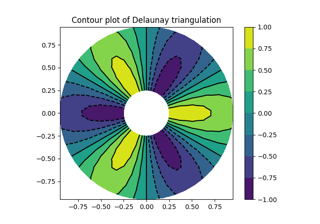
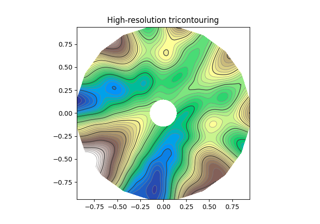
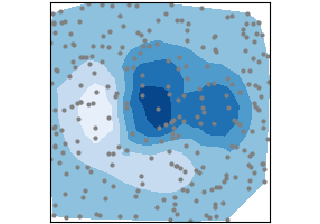
Draw contour regions on an unstructured triangular grid.
Call signatures:
tricontourf(triangulation, z, [levels], ...)
tricontourf(x, y, z, [levels], *, [triangles=triangles], [mask=mask], ...)
The triangular grid can be specified either by passing a
Triangulationobject as the first parameter, or by passing the points x, y and optionally the triangles and a mask. SeeTriangulationfor an explanation of these parameters. If neither of triangulation or triangles are given, the triangulation is calculated on the fly.It is possible to pass triangles positionally, i.e.
tricontourf(x, y, triangles, z, ...). However, this is discouraged. For more clarity, pass triangles via keyword argument.- Parameters:
- triangulation
Triangulation, optional An already created triangular grid.
- x, y, triangles, mask
Parameters defining the triangular grid. See
Triangulation. This is mutually exclusive with specifying triangulation.- zarray-like
The height values over which the contour is drawn. Color-mapping is controlled by cmap, norm, vmin, and vmax.
Note
All values in z must be finite. Hence, nan and inf values must either be removed or
set_maskbe used.- levelsint or array-like, optional
Determines the number and positions of the contour lines / regions.
If an int n, use
MaxNLocator, which tries to automatically choose no more than n+1 "nice" contour levels between between minimum and maximum numeric values of Z.If array-like, draw contour lines at the specified levels. The values must be in increasing order.
- triangulation
- Returns:
- Other Parameters:
- colorscolor or list of color, optional
The colors of the levels, i.e., the contour regions.
The sequence is cycled for the levels in ascending order. If the sequence is shorter than the number of levels, it is repeated.
As a shortcut, single color strings may be used in place of one-element lists, i.e.
'red'instead of['red']to color all levels with the same color. This shortcut does only work for color strings, not for other ways of specifying colors.By default (value None), the colormap specified by cmap will be used.
- alphafloat, default: 1
The alpha blending value, between 0 (transparent) and 1 (opaque).
- cmapstr or
Colormap, default:rcParams["image.cmap"](default:'viridis') The Colormap instance or registered colormap name used to map scalar data to colors.
This parameter is ignored if colors is set.
- normstr or
Normalize, optional The normalization method used to scale scalar data to the [0, 1] range before mapping to colors using cmap. By default, a linear scaling is used, mapping the lowest value to 0 and the highest to 1.
If given, this can be one of the following:
An instance of
Normalizeor one of its subclasses (see Colormap normalization).A scale name, i.e. one of "linear", "log", "symlog", "logit", etc. For a list of available scales, call
matplotlib.scale.get_scale_names(). In that case, a suitableNormalizesubclass is dynamically generated and instantiated.
This parameter is ignored if colors is set.
- vmin, vmaxfloat, optional
When using scalar data and no explicit norm, vmin and vmax define the data range that the colormap covers. By default, the colormap covers the complete value range of the supplied data. It is an error to use vmin/vmax when a norm instance is given (but using a
strnorm name together with vmin/vmax is acceptable).If vmin or vmax are not given, the default color scaling is based on levels.
This parameter is ignored if colors is set.
- origin{None, 'upper', 'lower', 'image'}, default: None
Determines the orientation and exact position of z by specifying the position of
z[0, 0]. This is only relevant, if X, Y are not given.None:
z[0, 0]is at X=0, Y=0 in the lower left corner.'lower':
z[0, 0]is at X=0.5, Y=0.5 in the lower left corner.'upper':
z[0, 0]is at X=N+0.5, Y=0.5 in the upper left corner.'image': Use the value from
rcParams["image.origin"](default:'upper').
- extent(x0, x1, y0, y1), optional
If origin is not None, then extent is interpreted as in
imshow: it gives the outer pixel boundaries. In this case, the position of z[0, 0] is the center of the pixel, not a corner. If origin is None, then (x0, y0) is the position of z[0, 0], and (x1, y1) is the position of z[-1, -1].This argument is ignored if X and Y are specified in the call to contour.
- locatorticker.Locator subclass, optional
The locator is used to determine the contour levels if they are not given explicitly via levels. Defaults to
MaxNLocator.- extend{'neither', 'both', 'min', 'max'}, default: 'neither'
Determines the
tricontourf-coloring of values that are outside the levels range.If 'neither', values outside the levels range are not colored. If 'min', 'max' or 'both', color the values below, above or below and above the levels range.
Values below
min(levels)and abovemax(levels)are mapped to the under/over values of theColormap. Note that most colormaps do not have dedicated colors for these by default, so that the over and under values are the edge values of the colormap. You may want to set these values explicitly usingColormap.set_underandColormap.set_over.Note
An existing
TriContourSetdoes not get notified if properties of its colormap are changed. Therefore, an explicit call toContourSet.changed()is needed after modifying the colormap. The explicit call can be left out, if a colorbar is assigned to theTriContourSetbecause it internally callsContourSet.changed().- xunits, yunitsregistered units, optional
Override axis units by specifying an instance of a
matplotlib.units.ConversionInterface.- antialiasedbool, optional
Enable antialiasing, overriding the defaults. For filled contours, the default is True. For line contours, it is taken from
rcParams["lines.antialiased"](default:True).- hatcheslist[str], optional
A list of crosshatch patterns to use on the filled areas. If None, no hatching will be added to the contour.
Notes
tricontourffills intervals that are closed at the top; that is, for boundaries z1 and z2, the filled region is:z1 < Z <= z2
except for the lowest interval, which is closed on both sides (i.e. it includes the lowest value).