Statistics#
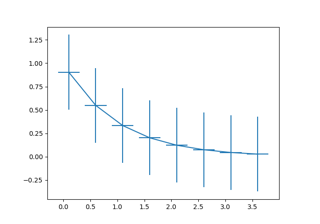


Create boxes from error bars using PatchCollection
Create boxes from error bars using PatchCollection
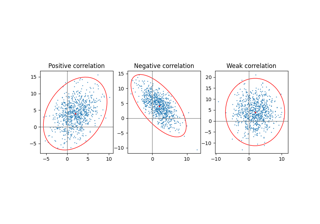
Plot a confidence ellipse of a two-dimensional dataset
Plot a confidence ellipse of a two-dimensional dataset


Demo of the histogram function's different histtype settings
Demo of the histogram function's different histtype settings


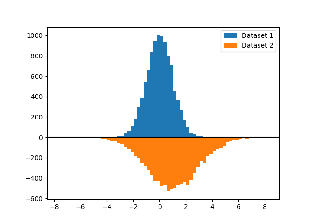
The histogram (hist) function with multiple data sets
The histogram (hist) function with multiple data sets