Note
Go to the end to download the full example code.
Axis ticks#
The x and y Axis on each Axes have default tick "locators" and "formatters"
that depend on the scale being used (see Axis scales). It is
possible to customize the ticks and tick labels with either high-level methods
like set_xticks or set the locators and formatters directly on
the axis.
Manual location and formats#
The simplest method to customize the tick locations and formats is to use
set_xticks and set_yticks. These can be used on
either the major or the minor ticks.
import numpy as np
import matplotlib.pyplot as plt

import matplotlib.ticker as ticker


fig, axs = plt.subplots(2, 1, figsize=(5.4, 5.4), layout='constrained')
x = np.arange(100)
for nn, ax in enumerate(axs):
    ax.plot(x, x)
    if nn == 1:
        ax.set_title('Manual ticks')
        ax.set_yticks(np.arange(0, 100.1, 100/3))
        xticks = np.arange(0.50, 101, 20)
        xlabels = [f'\\${x:1.2f}' for x in xticks]
        ax.set_xticks(xticks, labels=xlabels)
    else:
        ax.set_title('Automatic ticks')
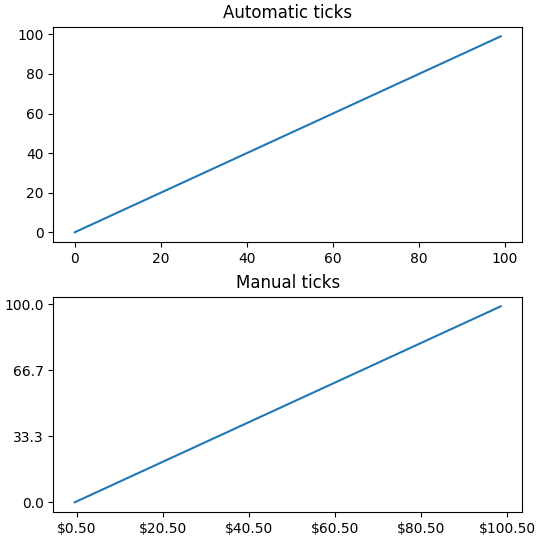
Note that the length of the labels argument must have the same length as
the array used to specify the ticks.
By default set_xticks and set_yticks act on the
major ticks of an Axis, however it is possible to add minor ticks:
fig, axs = plt.subplots(2, 1, figsize=(5.4, 5.4), layout='constrained')
x = np.arange(100)
for nn, ax in enumerate(axs):
    ax.plot(x, x)
    if nn == 1:
        ax.set_title('Manual ticks')
        ax.set_yticks(np.arange(0, 100.1, 100/3))
        ax.set_yticks(np.arange(0, 100.1, 100/30), minor=True)
    else:
        ax.set_title('Automatic ticks')

Locators and Formatters#
Manually setting the ticks as above works well for specific final plots, but
does not adapt as the user interacts with the Axes. At a lower level,
Matplotlib has Locators that are meant to automatically choose ticks
depending on the current view limits of the axis, and Formatters that are
meant to format the tick labels automatically.
The full list of locators provided by Matplotlib are listed at Tick locating, and the formatters at Tick formatting.
def setup(ax, title):
    """Set up common parameters for the Axes in the example."""
    # only show the bottom spine
    ax.yaxis.set_major_locator(ticker.NullLocator())
    ax.spines[['left', 'right', 'top']].set_visible(False)

    ax.xaxis.set_ticks_position('bottom')
    ax.tick_params(which='major', width=1.00, length=5)
    ax.tick_params(which='minor', width=0.75, length=2.5)
    ax.set_xlim(0, 5)
    ax.set_ylim(0, 1)
    ax.text(0.0, 0.2, title, transform=ax.transAxes,
            fontsize=14, fontname='Monospace', color='tab:blue')


fig, axs = plt.subplots(8, 1, layout='constrained')

# Null Locator
setup(axs[0], title="NullLocator()")
axs[0].xaxis.set_major_locator(ticker.NullLocator())
axs[0].xaxis.set_minor_locator(ticker.NullLocator())

# Multiple Locator
setup(axs[1], title="MultipleLocator(0.5)")
axs[1].xaxis.set_major_locator(ticker.MultipleLocator(0.5))
axs[1].xaxis.set_minor_locator(ticker.MultipleLocator(0.1))

# Fixed Locator
setup(axs[2], title="FixedLocator([0, 1, 5])")
axs[2].xaxis.set_major_locator(ticker.FixedLocator([0, 1, 5]))
axs[2].xaxis.set_minor_locator(ticker.FixedLocator(np.linspace(0.2, 0.8, 4)))

# Linear Locator
setup(axs[3], title="LinearLocator(numticks=3)")
axs[3].xaxis.set_major_locator(ticker.LinearLocator(3))
axs[3].xaxis.set_minor_locator(ticker.LinearLocator(31))

# Index Locator
setup(axs[4], title="IndexLocator(base=0.5, offset=0.25)")
axs[4].plot(range(0, 5), [0]*5, color='white')
axs[4].xaxis.set_major_locator(ticker.IndexLocator(base=0.5, offset=0.25))

# Auto Locator
setup(axs[5], title="AutoLocator()")
axs[5].xaxis.set_major_locator(ticker.AutoLocator())
axs[5].xaxis.set_minor_locator(ticker.AutoMinorLocator())

# MaxN Locator
setup(axs[6], title="MaxNLocator(n=4)")
axs[6].xaxis.set_major_locator(ticker.MaxNLocator(4))
axs[6].xaxis.set_minor_locator(ticker.MaxNLocator(40))

# Log Locator
setup(axs[7], title="LogLocator(base=10, numticks=15)")
axs[7].set_xlim(10**3, 10**10)
axs[7].set_xscale('log')
axs[7].xaxis.set_major_locator(ticker.LogLocator(base=10, numticks=15))
plt.show()

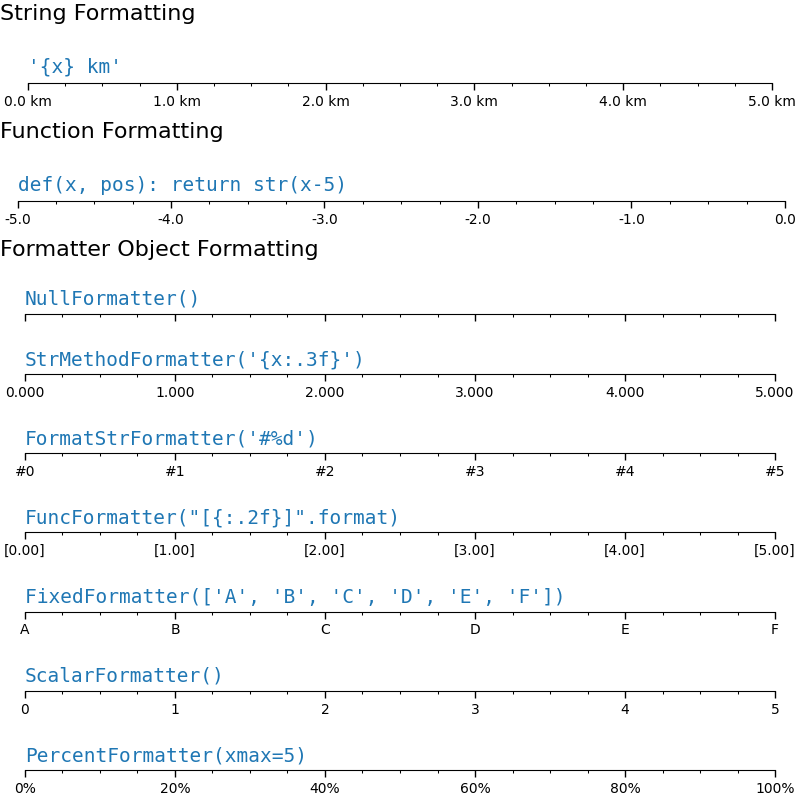
Similarly, we can specify "Formatters" for the major and minor ticks on each axis.
The tick format is configured via the function set_major_formatter
or set_minor_formatter. It accepts:
a format string, which implicitly creates a
StrMethodFormatter.a function, implicitly creates a
FuncFormatter.an instance of a
Formattersubclass. The most common areNullFormatter: No labels on the ticks.StrMethodFormatter: Use stringstr.formatmethod.FormatStrFormatter: Use %-style formatting.FuncFormatter: Define labels through a function.FixedFormatter: Set the label strings explicitly.ScalarFormatter: Default formatter for scalars: auto-pick the format string.PercentFormatter: Format labels as a percentage.
See Tick formatting for the complete list.
def setup(ax, title):
    """Set up common parameters for the Axes in the example."""
    # only show the bottom spine
    ax.yaxis.set_major_locator(ticker.NullLocator())
    ax.spines[['left', 'right', 'top']].set_visible(False)

    # define tick positions
    ax.xaxis.set_major_locator(ticker.MultipleLocator(1.00))
    ax.xaxis.set_minor_locator(ticker.MultipleLocator(0.25))

    ax.xaxis.set_ticks_position('bottom')
    ax.tick_params(which='major', width=1.00, length=5)
    ax.tick_params(which='minor', width=0.75, length=2.5, labelsize=10)
    ax.set_xlim(0, 5)
    ax.set_ylim(0, 1)
    ax.text(0.0, 0.2, title, transform=ax.transAxes,
            fontsize=14, fontname='Monospace', color='tab:blue')


fig = plt.figure(figsize=(8, 8), layout='constrained')
fig0, fig1, fig2 = fig.subfigures(3, height_ratios=[1.5, 1.5, 7.5])

fig0.suptitle('String Formatting', fontsize=16, x=0, ha='left')
ax0 = fig0.subplots()

setup(ax0, title="'{x} km'")
ax0.xaxis.set_major_formatter('{x} km')

fig1.suptitle('Function Formatting', fontsize=16, x=0, ha='left')
ax1 = fig1.subplots()

setup(ax1, title="def(x, pos): return str(x-5)")
ax1.xaxis.set_major_formatter(lambda x, pos: str(x-5))

fig2.suptitle('Formatter Object Formatting', fontsize=16, x=0, ha='left')
axs2 = fig2.subplots(7, 1)

setup(axs2[0], title="NullFormatter()")
axs2[0].xaxis.set_major_formatter(ticker.NullFormatter())

setup(axs2[1], title="StrMethodFormatter('{x:.3f}')")
axs2[1].xaxis.set_major_formatter(ticker.StrMethodFormatter("{x:.3f}"))

setup(axs2[2], title="FormatStrFormatter('#%d')")
axs2[2].xaxis.set_major_formatter(ticker.FormatStrFormatter("#%d"))


def fmt_two_digits(x, pos):
    return f'[{x:.2f}]'


setup(axs2[3], title='FuncFormatter("[{:.2f}]".format)')
axs2[3].xaxis.set_major_formatter(ticker.FuncFormatter(fmt_two_digits))

setup(axs2[4], title="FixedFormatter(['A', 'B', 'C', 'D', 'E', 'F'])")
# FixedFormatter should only be used together with FixedLocator.
# Otherwise, one cannot be sure where the labels will end up.
positions = [0, 1, 2, 3, 4, 5]
labels = ['A', 'B', 'C', 'D', 'E', 'F']
axs2[4].xaxis.set_major_locator(ticker.FixedLocator(positions))
axs2[4].xaxis.set_major_formatter(ticker.FixedFormatter(labels))

setup(axs2[5], title="ScalarFormatter()")
axs2[5].xaxis.set_major_formatter(ticker.ScalarFormatter(useMathText=True))

setup(axs2[6], title="PercentFormatter(xmax=5)")
axs2[6].xaxis.set_major_formatter(ticker.PercentFormatter(xmax=5))
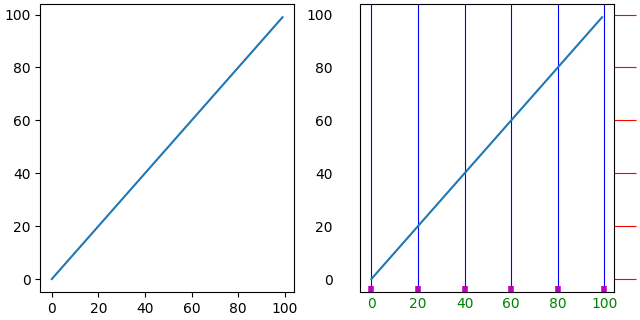
Styling ticks (tick parameters)#
The appearance of ticks can be controlled at a low level by finding the
individual Tick on the axis. However, usually it is simplest to
use tick_params to change all the objects at once.
The tick_params method can change the properties of ticks:
length
direction (in or out of the frame)
colors
width and length
and whether the ticks are drawn at the bottom, top, left, or right of the Axes.
It also can control the tick labels:
labelsize (fontsize)
labelcolor (color of the label)
labelrotation
labelbottom, labeltop, labelleft, labelright
In addition there is a pad keyword argument that specifies how far the tick label is from the tick.
Finally, the grid linestyles can be set:
grid_color
grid_alpha
grid_linewidth
grid_linestyle
All these properties can be restricted to one axis, and can be applied to just the major or minor ticks
fig, axs = plt.subplots(1, 2, figsize=(6.4, 3.2), layout='constrained')

for nn, ax in enumerate(axs):
    ax.plot(np.arange(100))
    if nn == 1:
        ax.grid('on')
        ax.tick_params(right=True, left=False, axis='y', color='r', length=16,
                       grid_color='none')
        ax.tick_params(axis='x', color='m', length=4, direction='in', width=4,
                       labelcolor='g', grid_color='b')
Tick objects#
Warning
Ticks are managed through the autoscaling / view limit mechanism, which may create, move and delete ticks as necessary.
Working with tick instances should only be an option of last resort and requires careful handling to not accidentally overwrite any manual changes through this mechanism.
If a tick configuration can be achieved through Axes.tick_params (see
Styling ticks (tick parameters)), that approach should be preferred.
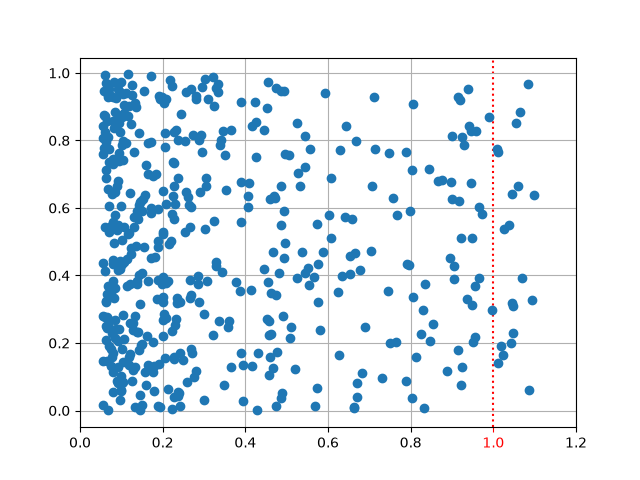
On the technical level, ticks are realized through Tick objects. They consist of
tick1line/tick2linefor the tick lines on either side of the axis.label1/label2for the tick labels on either side of the axis.gridlinefor the grid line.
These objects are publicly accessible through Axes methods and Axis methods and allow extreme customization such as coloring a specific tick line or tick label separately.
x = 1.1 * np.exp(-3 * np.random.random(500))
y = np.random.random(500)

fig, ax = plt.subplots()

ax.plot(x, y, 'o')
ax.grid()
ticks = ax.set_xticks([0, 0.2, 0.4, 0.6, 0.8, 1, 1.2])
ticks[5].label1.set_color("red")
ticks[5].tick1line.set_markeredgecolor("red")
ticks[5].gridline.set(visible=True, linestyle=':', linewidth=1.5, color='red')
Because of the managed nature of ticks, such operations only make sense for static output (e.g., when using the jupyter inline backend or saving the figure to a file) or when you are sure that the view limits of the axis will not change (e.g., when using a fixed locator).
In contrast, Axes.tick_params configures the default properties so that they are
applied to all current and future ticks.
Total running time of the script: (0 minutes 6.003 seconds)