Introduction to Artists#
Almost all objects you interact with on a Matplotlib plot are called "Artist"
(and are subclasses of the Artist class). Figure
and Axes are Artists, and generally contain
Axis Artists and Artists that contain data or annotation information.
Creating Artists#
Usually we do not instantiate Artists directly, but rather use a plotting
method on Axes. Some examples of plotting methods and the Artist
object they create is given below:
Axes helper method |
Artist |
|---|---|
|
|
|
|
|
|
|
|
|
|
|
|
|
|
|
|
|
|
|
As an example, we can save the Line2D Artist returned from axes.Axes.plot:
In [209]: import matplotlib.pyplot as plt
In [210]: import matplotlib.artist as martist
In [211]: import numpy as np

In [212]: fig, ax = plt.subplots()
In [213]: x, y = np.random.rand(2, 100)
In [214]: lines = ax.plot(x, y, '-', label='example')
In [215]: print(lines)
[<matplotlib.lines.Line2D at 0xd378b0c>]
Note that plot returns a _list_ of lines because you can pass in multiple x,
y pairs to plot. The line has been added to the Axes, and we can retrieve the
Artist via get_lines():
In [216]: print(ax.get_lines())
<a list of 1 Line2D objects>
In [217]: print(ax.get_lines()[0])
Line2D(example)
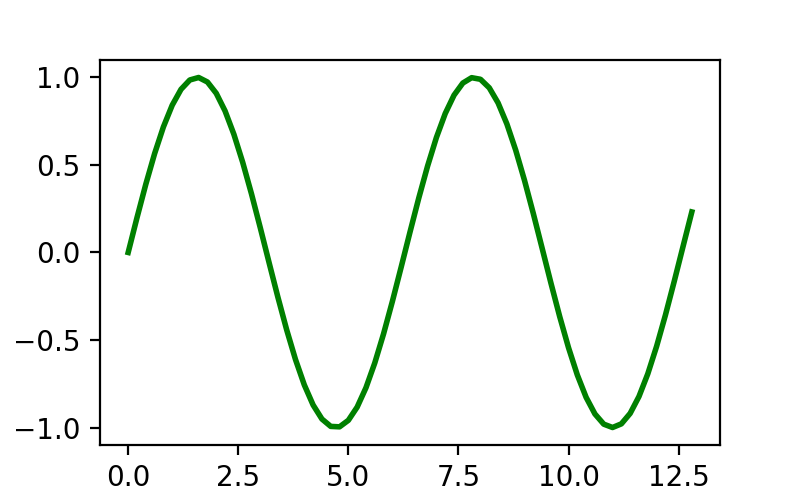
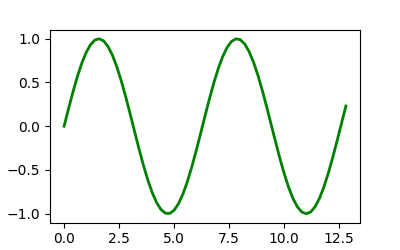
Changing Artist properties#
Getting the lines object gives us access to all the properties of the
Line2D object. So if we want to change the linewidth after the fact, we can do so using Artist.set.
fig, ax = plt.subplots(figsize=(4, 2.5))
x = np.arange(0, 13, 0.2)
y = np.sin(x)
lines = ax.plot(x, y, '-', label='example', linewidth=0.2, color='blue')
lines[0].set(color='green', linewidth=2)
(Source code, 2x.png, png)

We can interrogate the full list of settable properties with
matplotlib.artist.getp:
In [218]: martist.getp(lines[0])
agg_filter = None
alpha = None
animated = False
antialiased or aa = True
bbox = Bbox(x0=0.004013842290585101, y0=0.013914221641967...
children = []
clip_box = TransformedBbox(     Bbox(x0=0.0, y0=0.0, x1=1.0, ...
clip_on = True
clip_path = None
color or c = blue
dash_capstyle = butt
dash_joinstyle = round
data = (array([0.91377845, 0.58456834, 0.36492019, 0.0379...
drawstyle or ds = default
figure = Figure(550x450)
fillstyle = full
gapcolor = None
gid = None
in_layout = True
label = example
linestyle or ls = -
linewidth or lw = 2.0
marker = None
markeredgecolor or mec = blue
markeredgewidth or mew = 1.0
markerfacecolor or mfc = blue
markerfacecoloralt or mfcalt = none
markersize or ms = 6.0
markevery = None
mouseover = False
path = Path(array([[0.91377845, 0.51224793],        [0.58...
path_effects = []
picker = None
pickradius = 5
rasterized = False
sketch_params = None
snap = None
solid_capstyle = projecting
solid_joinstyle = round
tightbbox = Bbox(x0=70.4609002763619, y0=54.321277798941786, x...
transform = CompositeGenericTransform(     TransformWrapper(  ...
transformed_clip_path_and_affine = (None, None)
url = None
visible = True
window_extent = Bbox(x0=70.4609002763619, y0=54.321277798941786, x...
xdata = [0.91377845 0.58456834 0.36492019 0.03796664 0.884...
xydata = [[0.91377845 0.51224793]  [0.58456834 0.9820474 ] ...
ydata = [0.51224793 0.9820474  0.24469912 0.61647032 0.483...
zorder = 2
Note most Artists also have a distinct list of setters; e.g.
Line2D.set_color or Line2D.set_linewidth.
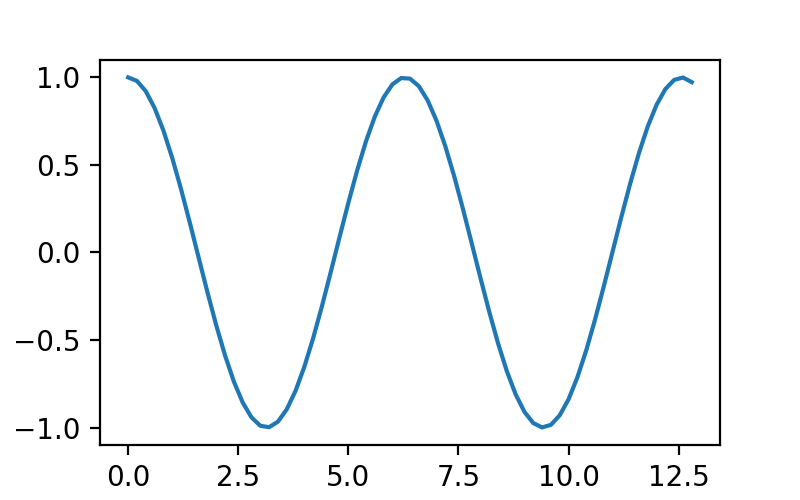
Changing Artist data#
In addition to styling properties like color and linewidth, the Line2D
object has a data property. You can set the data after the line has been
created using Line2D.set_data. This is often used for Animations, where the
same line is shown evolving over time (see Animations using Matplotlib)
fig, ax = plt.subplots(figsize=(4, 2.5))
x = np.arange(0, 13, 0.2)
y = np.sin(x)
lines = ax.plot(x, y, '-', label='example')
lines[0].set_data([x, np.cos(x)])
(Source code, 2x.png, png)

Manually adding Artists#
Not all Artists have helper methods, or you may want to use a low-level method
for some reason. For example the patches.Circle Artist does not have a
helper, but we can still create and add to an Axes using the
axes.Axes.add_artist method:
import matplotlib.patches as mpatches

fig, ax = plt.subplots(figsize=(4, 2.5))
circle = mpatches.Circle((0.5, 0.5), 0.25, ec="none")
ax.add_artist(circle)
clipped_circle = mpatches.Circle((1, 0.5), 0.125, ec="none", facecolor='C1')
ax.add_artist(clipped_circle)
ax.set_aspect(1)
(Source code, 2x.png, png)
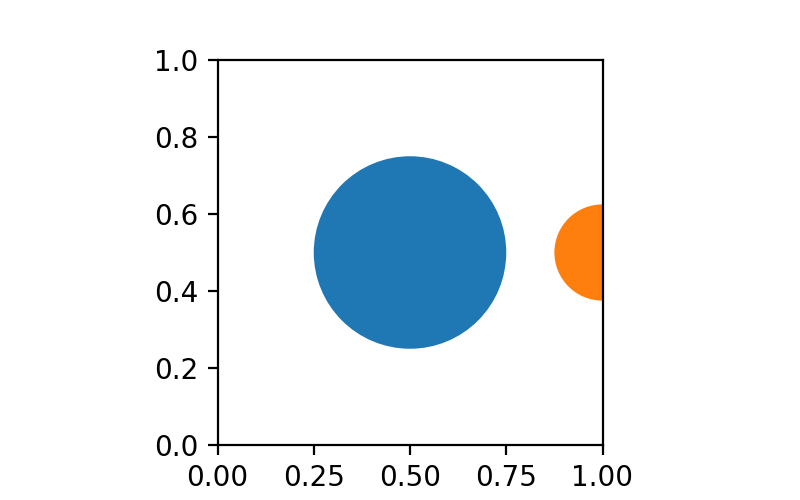
The Circle takes the center and radius of the Circle as arguments to its constructor; optional arguments are passed as keyword arguments.
Note that when we add an Artist manually like this, it doesn't necessarily
adjust the axis limits like most of the helper methods do, so the Artists can
be clipped, as is the case above for the clipped_circle patch.
See Reference for Matplotlib artists for other patches.
Removing Artists#
Sometimes we want to remove an Artist from a figure without re-specifying the
whole figure from scratch. Most Artists have a usable remove method that
will remove the Artist from its Axes list. For instance lines[0].remove()
would remove the Line2D artist created in the example above.