Note
Go to the end to download the full example code.
Customized Colorbars Tutorial#
This tutorial shows how to build and customize standalone colorbars, i.e. without an attached plot.
A colorbar requires a matplotlib.colorizer.ColorizingArtist which
contains a matplotlib.colorizer.Colorizer that holds the data-to-color pipeline
(norm and colormap). To create a colorbar without an attached plot one can
directly instantiate the base class ColorizingArtist, which has no associated
data.
import matplotlib.pyplot as plt

import matplotlib as mpl
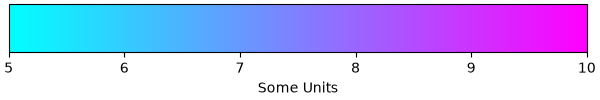
Basic continuous colorbar#
Here, we create a basic continuous colorbar with ticks and labels.
The arguments to the colorbar call are a ColorizingArtist,
the axes where the colorbar should be drawn, and the colorbar's orientation.
To crate a ColorizingArtist one must first make Colorizer that holds the
desired norm and cmap.
For more information see the colorbar API.
fig, ax = plt.subplots(figsize=(6, 1), layout='constrained')

norm = mpl.colors.Normalize(vmin=5, vmax=10)

colorizer = mpl.colorizer.Colorizer(norm=norm, cmap="cool")

fig.colorbar(mpl.colorizer.ColorizingArtist(colorizer),
             cax=ax, orientation='horizontal', label='Some Units')
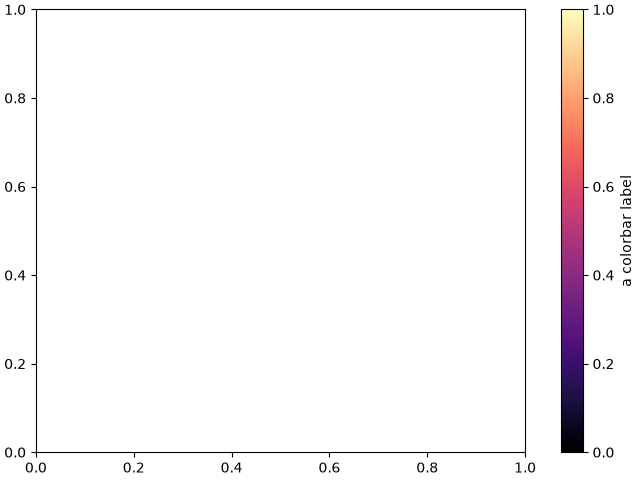
Colorbar attached next to a pre-existing axes#
All examples in this tutorial (except this one) show a standalone colorbar on
its own figure, but it is possible to display the colorbar next to a
pre-existing Axes ax by passing ax=ax to the colorbar() call (meaning
"draw the colorbar next to ax") rather than cax=ax (meaning "draw the
colorbar on ax").
fig, ax = plt.subplots(layout='constrained')

colorizer = mpl.colorizer.Colorizer(norm=mpl.colors.Normalize(0, 1), cmap='magma')

fig.colorbar(mpl.colorizer.ColorizingArtist(colorizer),
             ax=ax, orientation='vertical', label='a colorbar label')
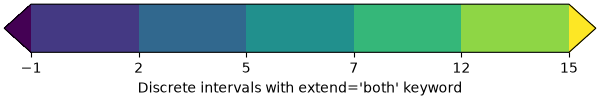
Discrete and extended colorbar with continuous colorscale#
The following example shows how to make a discrete colorbar based on a
continuous cmap. We use matplotlib.colors.BoundaryNorm to describe the
interval boundaries (which must be in increasing order), and further pass the
extend argument to it to further display "over" and "under" colors (which
are used for data outside of the norm range).
fig, ax = plt.subplots(figsize=(6, 1), layout='constrained')

cmap = mpl.colormaps["viridis"]
bounds = [-1, 2, 5, 7, 12, 15]
norm = mpl.colors.BoundaryNorm(bounds, cmap.N, extend='both')

colorizer = mpl.colorizer.Colorizer(norm=norm, cmap='viridis')

fig.colorbar(mpl.colorizer.ColorizingArtist(colorizer),
             cax=ax, orientation='horizontal',
             label="Discrete intervals with extend='both' keyword")
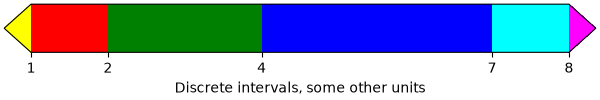
Colorbar with arbitrary colors#
The following example still uses a BoundaryNorm to describe discrete
interval boundaries, but now uses a matplotlib.colors.ListedColormap to
associate each interval with an arbitrary color (there must be as many
intervals than there are colors).
We also pass additional arguments to colorbar:
To display the out-of-range values on the colorbar, we use the extend argument in the colorbar() call. (This is equivalent to passing the extend argument in the
BoundaryNormconstructor as done in the previous example.)To make the length of each colorbar segment proportional to its corresponding interval, we use the spacing argument in the colorbar() call.
fig, ax = plt.subplots(figsize=(6, 1), layout='constrained')

cmap = mpl.colors.ListedColormap(
    ['red', 'green', 'blue', 'cyan'], under='yellow', over='magenta')
bounds = [1, 2, 4, 7, 8]
norm = mpl.colors.BoundaryNorm(bounds, cmap.N)

colorizer = mpl.colorizer.Colorizer(norm=norm, cmap=cmap)

fig.colorbar(
    mpl.colorizer.ColorizingArtist(colorizer),
    cax=ax, orientation='horizontal',
    extend='both',
    spacing='proportional',
    label='Discrete intervals, some other units',
)
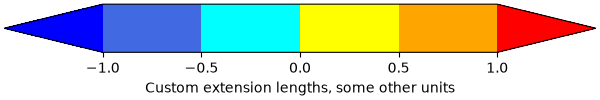
Colorbar with custom extension lengths#
We can customize the length colorbar extensions, on a colorbar with discrete
intervals. To make the length of each extension the
same as the length of the interior colors, use extendfrac='auto'.
fig, ax = plt.subplots(figsize=(6, 1), layout='constrained')

cmap = mpl.colors.ListedColormap(
    ['royalblue', 'cyan', 'yellow', 'orange'], over='red', under='blue')
bounds = [-1.0, -0.5, 0.0, 0.5, 1.0]
norm = mpl.colors.BoundaryNorm(bounds, cmap.N)

colorizer = mpl.colorizer.Colorizer(norm=norm, cmap=cmap)

fig.colorbar(
    mpl.colorizer.ColorizingArtist(colorizer),
    cax=ax, orientation='horizontal',
    extend='both', extendfrac='auto',
    spacing='uniform',
    label='Custom extension lengths, some other units',
)

plt.show()
Total running time of the script: (0 minutes 1.030 seconds)