Axes and subplots#
Matplotlib Axes are the gateway to creating your data visualizations.
Once an Axes is placed on a figure there are many methods that can be used to
add data to the Axes. An Axes typically has a pair of Axis
Artists that define the data coordinate system, and include methods to add
annotations like x- and y-labels, titles, and legends.
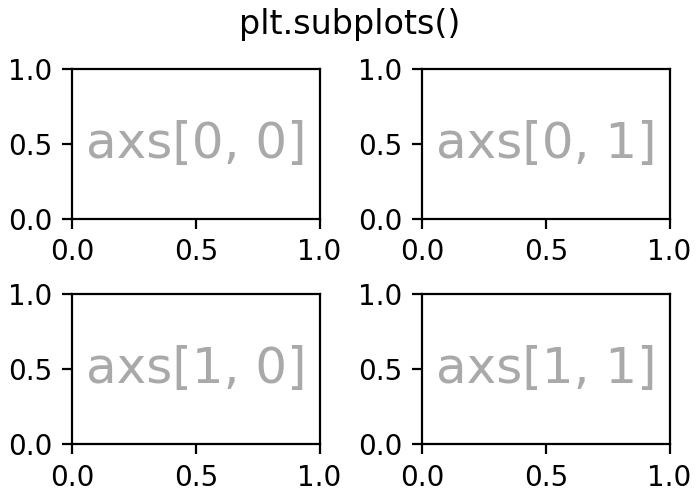
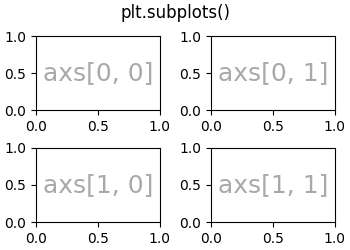
(Source code, 2x.png, png)
