Frequently Asked Questions#
I don't see a figure window#
Please see Debugging the figure windows not showing.
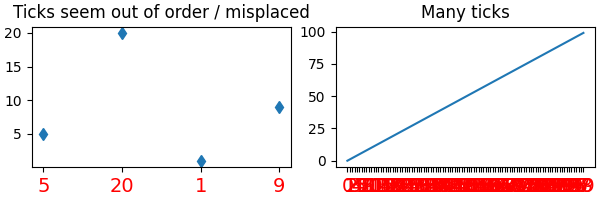
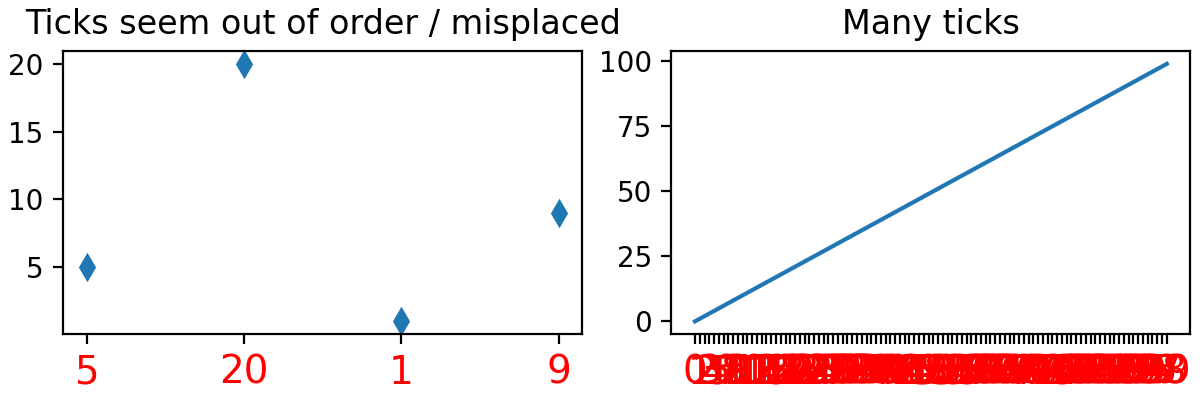
Why do I have so many ticks, and/or why are they out of order?#
One common cause for unexpected tick behavior is passing a list of strings instead of numbers or datetime objects. This can easily happen without notice when reading in a comma-delimited text file. Matplotlib treats lists of strings as categorical variables (Plotting categorical variables), and by default puts one tick per category, and plots them in the order in which they are supplied.
import matplotlib.pyplot as plt
import numpy as np

fig, ax = plt.subplots(1, 2, layout='constrained', figsize=(6, 2))

ax[0].set_title('Ticks seem out of order / misplaced')
x = ['5', '20', '1', '9']  # strings
y = [5, 20, 1, 9]
ax[0].plot(x, y, 'd')
ax[0].tick_params(axis='x', labelcolor='red', labelsize=14)

ax[1].set_title('Many ticks')
x = [str(xx) for xx in np.arange(100)]  # strings
y = np.arange(100)
ax[1].plot(x, y)
ax[1].tick_params(axis='x', labelcolor='red', labelsize=14)
(Source code, 2x.png, png)
The solution is to convert the list of strings to numbers or
datetime objects (often np.asarray(numeric_strings, dtype='float') or
np.asarray(datetime_strings, dtype='datetime64[s]')).
For more information see Fixing too many ticks.
Determine the extent of Artists in the Figure#
Sometimes we want to know the extent of an Artist. Matplotlib Artist objects
have a method Artist.get_window_extent that will usually return the extent of
the artist in pixels. However, some artists, in particular text, must be
rendered at least once before their extent is known. Matplotlib supplies
Figure.draw_without_rendering, which should be called before calling
get_window_extent.
Check whether a figure is empty#
Empty can actually mean different things. Does the figure contain any artists?
Does a figure with an empty Axes still count as empty? Is the figure
empty if it was rendered pure white (there may be artists present, but they
could be outside the drawing area or transparent)?
For the purpose here, we define empty as: "The figure does not contain any
artists except its background patch." The exception for the background is
necessary, because by default every figure contains a Rectangle as its
background patch. This definition could be checked via:
def is_empty(figure):
    """
    Return whether the figure contains no Artists (other than the default
    background patch).
    """
    contained_artists = figure.get_children()
    return len(contained_artists) <= 1
We've decided not to include this as a figure method because this is only one way of defining empty, and checking the above is only rarely necessary. Whether or not something has been added to the figure is usually defined within the context of the program.
The only reliable way to check whether a figure would render empty is to actually perform such a rendering and inspect the result.
Find all objects in a figure of a certain type#
Every Matplotlib artist (see Artist tutorial) has a method
called findobj() that can be used to
recursively search the artist for any artists it may contain that meet
some criteria (e.g., match all Line2D
instances or match some arbitrary filter function). For example, the
following snippet finds every object in the figure which has a
set_color property and makes the object blue:
def myfunc(x):
    return hasattr(x, 'set_color')

for o in fig.findobj(myfunc):
    o.set_color('blue')
You can also filter on class instances:
import matplotlib.text as text
for o in fig.findobj(text.Text):
    o.set_fontstyle('italic')
Prevent ticklabels from having an offset#
The default formatter will use an offset to reduce the length of the ticklabels. To turn this feature off on a per-axis basis:
ax.xaxis.get_major_formatter().set_useOffset(False)
set rcParams["axes.formatter.useoffset"] (default: True), or use a different
formatter. See ticker for details.
Save transparent figures#
The savefig() command has a keyword argument
transparent which, if 'True', will make the figure and axes
backgrounds transparent when saving, but will not affect the displayed
image on the screen.
If you need finer grained control, e.g., you do not want full transparency
or you want to affect the screen displayed version as well, you can set
the alpha properties directly. The figure has a
Rectangle instance called patch
and the axes has a Rectangle instance called patch. You can set
any property on them directly (facecolor, edgecolor, linewidth,
linestyle, alpha). e.g.:
fig = plt.figure()
fig.patch.set_alpha(0.5)
ax = fig.add_subplot(111)
ax.patch.set_alpha(0.5)
If you need all the figure elements to be transparent, there is currently no global alpha setting, but you can set the alpha channel on individual elements, e.g.:
ax.plot(x, y, alpha=0.5)
ax.set_xlabel('volts', alpha=0.5)
Save multiple plots to one pdf file#
Many image file formats can only have one image per file, but some formats
support multi-page files. Currently, Matplotlib only provides multi-page
output to pdf files, using either the pdf or pgf backends, via the
backend_pdf.PdfPages and backend_pgf.PdfPages classes.
Make room for tick labels#
By default, Matplotlib uses fixed percentage margins around subplots. This can lead to labels overlapping or being cut off at the figure boundary. There are multiple ways to fix this:
Manually adapt the subplot parameters using
Figure.subplots_adjust/pyplot.subplots_adjust.Use one of the automatic layout mechanisms:
constrained layout (Constrained layout guide)
tight layout (Tight layout guide)
Calculate good values from the size of the plot elements yourself (Programmatically control subplot adjustment)
Align my ylabels across multiple subplots#
If you have multiple subplots over one another, and the y data have different scales, you can often get ylabels that do not align vertically across the multiple subplots, which can be unattractive. By default, Matplotlib positions the x location of the ylabel so that it does not overlap any of the y ticks. You can override this default behavior by specifying the coordinates of the label. To learn how, see Align labels and titles
Control the draw order of plot elements#
The draw order of plot elements, and thus which elements will be on top, is
determined by the set_zorder property.
See Zorder Demo for a detailed description.
Make the aspect ratio for plots equal#
The Axes property set_aspect() controls the
aspect ratio of the axes. You can set it to be 'auto', 'equal', or
some ratio which controls the ratio:
ax = fig.add_subplot(111, aspect='equal')
See Equal axis aspect ratio for a complete example.
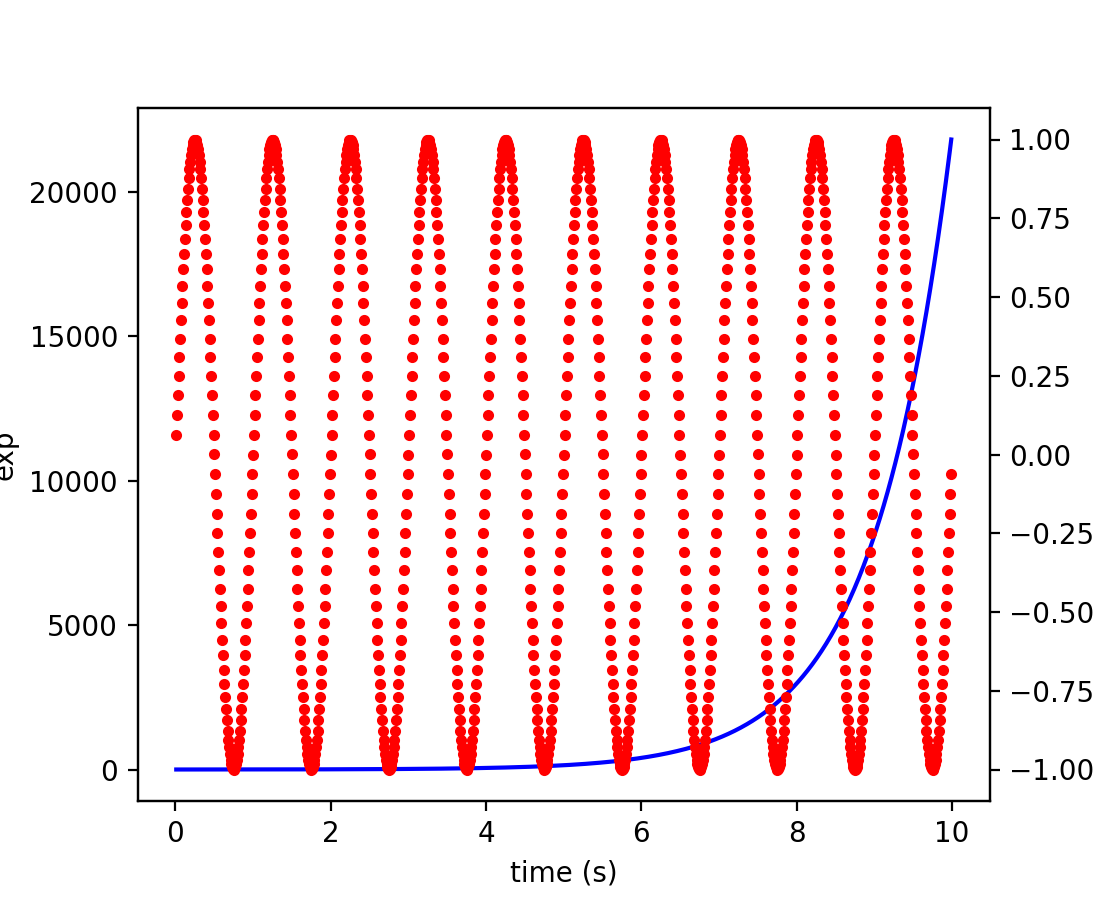
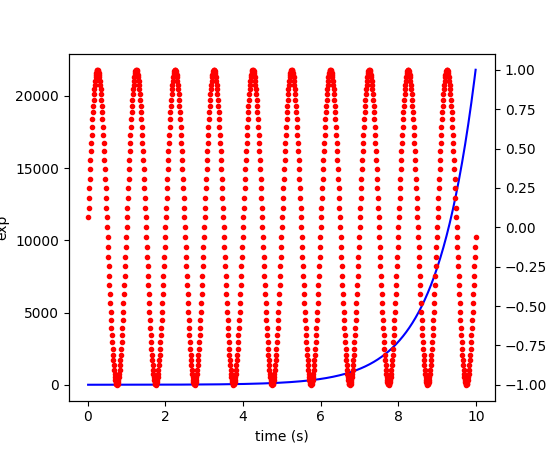
Draw multiple y-axis scales#
A frequent request is to have two scales for the left and right
y-axis, which is possible using twinx() (more
than two scales are not currently supported, though it is on the wish
list). This works pretty well, though there are some quirks when you
are trying to interactively pan and zoom, because both scales do not get
the signals.
The approach uses twinx() (and its sister
twiny()) to use 2 different axes,
turning the axes rectangular frame off on the 2nd axes to keep it from
obscuring the first, and manually setting the tick locs and labels as
desired. You can use separate matplotlib.ticker formatters and
locators as desired because the two axes are independent.
(Source code, 2x.png, png)

See Plots with different scales for a complete example.
Generate images without having a window appear#
The recommended approach since Matplotlib 3.1 is to explicitly create a Figure instance:
from matplotlib.figure import Figure
fig = Figure()
ax = fig.subplots()
ax.plot([1, 2, 3])
fig.savefig('myfig.png')
This prevents any interaction with GUI frameworks and the window manager.
It's alternatively still possible to use the pyplot interface: instead of
calling matplotlib.pyplot.show, call matplotlib.pyplot.savefig. In that
case, you must close the figure after saving it. Not closing the figure causes
a memory leak, because pyplot keeps references to all not-yet-shown figures.
import matplotlib.pyplot as plt
plt.plot([1, 2, 3])
plt.savefig('myfig.png')
plt.close()
See also
Embed in a web application server (Flask) for information about running matplotlib inside of a web application.
Work with threads#
Matplotlib is not thread-safe: in fact, there are known race conditions that affect certain artists. Hence, if you work with threads, it is your responsibility to set up the proper locks to serialize access to Matplotlib artists.
You may be able to work on separate figures from separate threads. However, you must in that case use a non-interactive backend (typically Agg), because most GUI backends require being run from the main thread as well.
Get help#
There are a number of good resources for getting help with Matplotlib. There is a good chance your question has already been asked:
The mailing list archive.
Stackoverflow questions tagged matplotlib.
If you are unable to find an answer to your question through search, please provide the following information in your e-mail to the mailing list:
Your operating system (Linux/Unix users: post the output of
uname -a).Matplotlib version:
python -c "import matplotlib; print(matplotlib.__version__)"
Where you obtained Matplotlib (e.g., your Linux distribution's packages, GitHub, PyPI, or Anaconda).
Any customizations to your
matplotlibrcfile (see Customizing Matplotlib with style sheets and rcParams).If the problem is reproducible, please try to provide a minimal, standalone Python script that demonstrates the problem. This is the critical step. If you can't post a piece of code that we can run and reproduce your error, the chances of getting help are significantly diminished. Very often, the mere act of trying to minimize your code to the smallest bit that produces the error will help you find a bug in your code that is causing the problem.
Matplotlib provides debugging information through the
logginglibrary, and a helper function to set the logging level: one can callplt.set_loglevel("INFO") # or "DEBUG" for more info
to obtain this debugging information.
Standard functions from the
loggingmodule are also applicable; e.g. one could calllogging.basicConfig(level="DEBUG")even before importing Matplotlib (this is in particular necessary to get the logging info emitted during Matplotlib's import), or attach a custom handler to the "matplotlib" logger. This may be useful if you use a custom logging configuration.
If you compiled Matplotlib yourself, please also provide:
your compiler version -- e.g.,
gcc --version.the output of:
pip install --verbose
The beginning of the build output contains lots of details about your platform that are useful for the Matplotlib developers to diagnose your problem.
If you compiled an older version of Matplotlib using the pre-Meson build system, instead provide:
any changes you have made to
setup.py/setupext.py,the output of:
rm -rf build
python setup.py build
Including this information in your first e-mail to the mailing list will save a lot of time.
You will likely get a faster response writing to the mailing list than filing a bug in the bug tracker. Most developers check the bug tracker only periodically. If your problem has been determined to be a bug and cannot be quickly solved, you may be asked to file a bug in the tracker so the issue doesn't get lost.