Note
Go to the end to download the full example code.
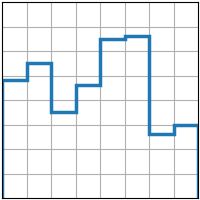
stairs(values)#
Draw a stepwise constant function as a line or a filled plot.
See stairs when plotting \(y\) between
\((x_i, x_{i+1})\). For plotting \(y\) at \(x\), see
step.
Note
Go to the end to download the full example code.
Draw a stepwise constant function as a line or a filled plot.
See stairs when plotting \(y\) between
\((x_i, x_{i+1})\). For plotting \(y\) at \(x\), see
step.