Note
Go to the end to download the full example code.
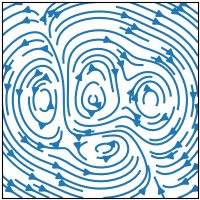
streamplot(X, Y, U, V)#
Draw streamlines of a vector flow.
See streamplot.
import matplotlib.pyplot as plt
import numpy as np

plt.style.use('_mpl-gallery-nogrid')

# make a stream function:
X, Y = np.meshgrid(np.linspace(-3, 3, 256), np.linspace(-3, 3, 256))
Z = (1 - X/2 + X**5 + Y**3) * np.exp(-X**2 - Y**2)
# make U and V out of the streamfunction:
V = np.diff(Z[1:, :], axis=1)
U = -np.diff(Z[:, 1:], axis=0)

# plot:
fig, ax = plt.subplots()

ax.streamplot(X[1:, 1:], Y[1:, 1:], U, V)

plt.show()