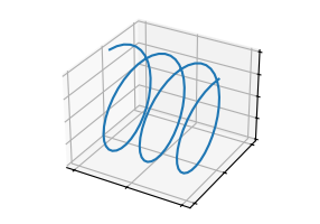
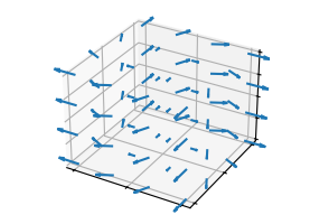
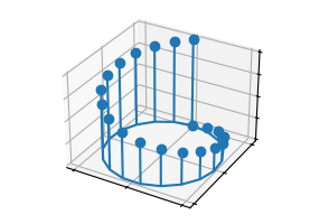
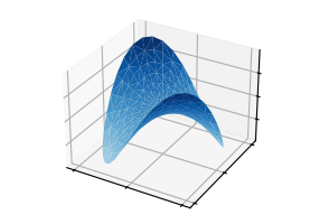
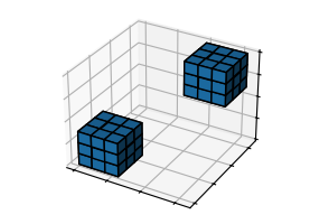
Ctrl+K
Logo image Logo image
  • Plot types
  • Examples
  • Tutorials
  • Reference
  • User guide
  • Develop
  • Release notes
  • Plot types
  • Examples
  • Tutorials
  • Reference
  • User guide
  • Develop
  • Release notes

Section Navigation

  • Basic
    • plot(x, y)
    • scatter(x, y)
    • bar(x, height)
    • stem(x, y)
    • step(x, y)
    • fill_between(x, y1, y2)
    • stackplot(x, y)
  • Plots of arrays and fields
    • imshow(Z)
    • pcolormesh(X, Y, Z)
    • contour(X, Y, Z)
    • contourf(X, Y, Z)
    • barbs(X, Y, U, V)
    • quiver(X, Y, U, V)
    • streamplot(X, Y, U, V)
  • Statistics plots
    • hist(x)
    • boxplot(X)
    • errorbar(x, y, yerr, xerr)
    • violinplot(D)
    • eventplot(D)
    • hist2d(x, y)
    • hexbin(x, y, C)
    • pie(x)
  • Unstructured coordinates
    • tricontour(x, y, z)
    • tricontourf(x, y, z)
    • tripcolor(x, y, z)
    • triplot(x, y)
  • 3D
    • 3D scatterplot
    • 3D surface
    • Triangular 3D surfaces
    • 3D voxel / volumetric plot
    • 3D wireframe plot

3D#

3D plots using the mpl_toolkits.mplot3d library.
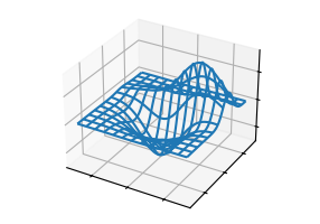
3D scatterplot

3D scatterplot

3D scatterplot
3D surface

3D surface

3D surface
Triangular 3D surfaces

Triangular 3D surfaces

Triangular 3D surfaces
3D voxel / volumetric plot

3D voxel / volumetric plot

3D voxel / volumetric plot
3D wireframe plot

3D wireframe plot

3D wireframe plot

© Copyright 2002–2012 John Hunter, Darren Dale, Eric Firing, Michael Droettboom and the Matplotlib development team; 2012–2023 The Matplotlib development team.

Built with the PyData Sphinx Theme 0.12.0.

Created using Sphinx 5.3.0.