Note
Go to the end to download the full example code.
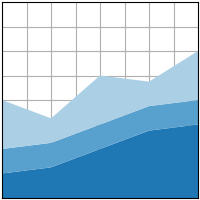
stackplot(x, y)#
Draw a stacked area plot or a streamgraph.
See stackplot
import matplotlib.pyplot as plt
import numpy as np

plt.style.use('_mpl-gallery')

# make data
x = np.arange(0, 10, 2)
ay = [1, 1.25, 2, 2.75, 3]
by = [1, 1, 1, 1, 1]
cy = [2, 1, 2, 1, 2]
y = np.vstack([ay, by, cy])

# plot
fig, ax = plt.subplots()

ax.stackplot(x, y)

ax.set(xlim=(0, 8), xticks=np.arange(1, 8),
       ylim=(0, 8), yticks=np.arange(1, 8))

plt.show()