Note
Go to the end to download the full example code.
bar(x, height)#
See bar.
import matplotlib.pyplot as plt
import numpy as np
plt.style.use('_mpl-gallery')
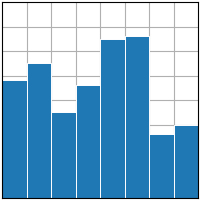
# make data:
x = 0.5 + np.arange(8)
y = [4.8, 5.5, 3.5, 4.6, 6.5, 6.6, 2.6, 3.0]
# plot
fig, ax = plt.subplots()
ax.bar(x, y, width=1, edgecolor="white", linewidth=0.7)
ax.set(xlim=(0, 8), xticks=np.arange(1, 8),
ylim=(0, 8), yticks=np.arange(1, 8))
plt.show()