matplotlib.axes.Axes.tick_params#
- Axes.tick_params(axis='both', **kwargs)[source]#
Change the appearance of ticks, tick labels, and gridlines.
Tick properties that are not explicitly set using the keyword arguments remain unchanged unless reset is True. For the current style settings, see
Axis.get_tick_params.- Parameters:
- axis{'x', 'y', 'both'}, default: 'both'
The axis to which the parameters are applied.
- which{'major', 'minor', 'both'}, default: 'major'
The group of ticks to which the parameters are applied.
- resetbool, default: False
Whether to reset the ticks to defaults before updating them.
- Other Parameters:
- direction{'in', 'out', 'inout'}
Puts ticks inside the Axes, outside the Axes, or both.
- lengthfloat
Tick length in points.
- widthfloat
Tick width in points.
- colorcolor
Tick color.
- padfloat
Distance in points between tick and label.
- labelsizefloat or str
Tick label font size in points or as a string (e.g., 'large').
- labelcolorcolor
Tick label color.
- labelfontfamilystr
Tick label font.
- colorscolor
Tick color and label color.
- zorderfloat
Tick and label zorder.
- bottom, top, left, rightbool
Whether to draw the respective ticks.
- labelbottom, labeltop, labelleft, labelrightbool
Whether to draw the respective tick labels.
- labelrotationfloat
Tick label rotation angle in degrees. See
Text.set_rotation.- labelrotation_mode{'default', 'anchor', 'xtick', 'ytick'}
Tick label rotation mode. See
Text.set_rotation_mode.- grid_colorcolor
Gridline color.
- grid_alphafloat
Transparency of gridlines: 0 (transparent) to 1 (opaque).
- grid_linewidthfloat
Width of gridlines in points.
- grid_linestylestr
Any valid
Line2Dline style spec.
Examples
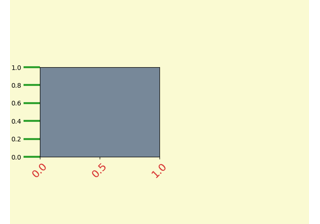
ax.tick_params(direction='out', length=6, width=2, colors='r',
               grid_color='r', grid_alpha=0.5)
This will make all major ticks be red, pointing out of the box, and with dimensions 6 points by 2 points. Tick labels will also be red. Gridlines will be red and translucent.