Note
Click here to download the full example code
Custom Ticker1
The new ticker code was designed to explicitly support user customized
ticking. The documentation of matplotlib.ticker details this
process. That code defines a lot of preset tickers but was primarily
designed to be user extensible.
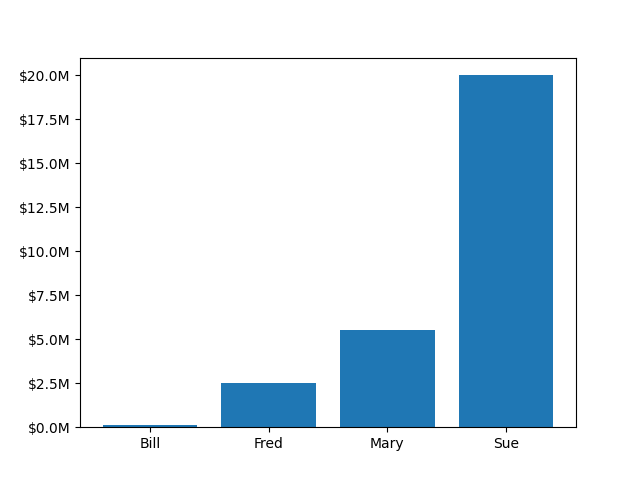
In this example a user defined function is used to format the ticks in millions of dollars on the y axis.
import matplotlib.pyplot as plt

money = [1.5e5, 2.5e6, 5.5e6, 2.0e7]


def millions(x, pos):
    """The two arguments are the value and tick position."""
    return '${:1.1f}M'.format(x*1e-6)

fig, ax = plt.subplots()
# Use automatic FuncFormatter creation
ax.yaxis.set_major_formatter(millions)
ax.bar(['Bill', 'Fred', 'Mary', 'Sue'], money)
plt.show()
References
The use of the following functions, methods, classes and modules is shown in this example:
Keywords: matplotlib code example, codex, python plot, pyplot Gallery generated by Sphinx-Gallery