Note
Click here to download the full example code
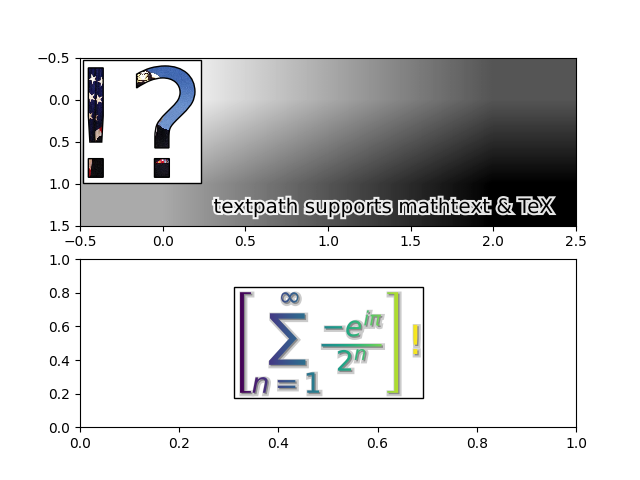
Using a text as a Path
TextPath creates a Path that is the outline of the
characters of a text. The resulting path can be employed e.g. as a clip path
for an image.
import matplotlib.pyplot as plt
from matplotlib.cbook import get_sample_data
from matplotlib.image import BboxImage
from matplotlib.offsetbox import (
    AnnotationBbox, AnchoredOffsetbox, AuxTransformBox)
from matplotlib.patches import PathPatch, Shadow
from matplotlib.text import TextPath
from matplotlib.transforms import IdentityTransform
import numpy as np


class PathClippedImagePatch(PathPatch):
    """
    The given image is used to draw the face of the patch. Internally,
    it uses BboxImage whose clippath set to the path of the patch.

    FIXME : The result is currently dpi dependent.
    """

    def __init__(self, path, bbox_image, **kwargs):
        super().__init__(path, **kwargs)
        self.bbox_image = BboxImage(
            self.get_window_extent, norm=None, origin=None)
        self.bbox_image.set_data(bbox_image)

    def set_facecolor(self, color):
        """Simply ignore facecolor."""
        super().set_facecolor("none")

    def draw(self, renderer=None):
        # the clip path must be updated every draw. any solution? -JJ
        self.bbox_image.set_clip_path(self._path, self.get_transform())
        self.bbox_image.draw(renderer)
        super().draw(renderer)


if __name__ == "__main__":

    usetex = plt.rcParams["text.usetex"]

    fig, (ax1, ax2) = plt.subplots(2)

    # EXAMPLE 1

    arr = plt.imread(get_sample_data("grace_hopper.jpg"))

    text_path = TextPath((0, 0), "!?", size=150)
    p = PathClippedImagePatch(text_path, arr, ec="k",
                              transform=IdentityTransform())

    # make offset box
    offsetbox = AuxTransformBox(IdentityTransform())
    offsetbox.add_artist(p)

    # make anchored offset box
    ao = AnchoredOffsetbox(loc='upper left', child=offsetbox, frameon=True,
                           borderpad=0.2)
    ax1.add_artist(ao)

    # another text
    from matplotlib.patches import PathPatch
    if usetex:
        r = r"\mbox{textpath supports mathtext \& \TeX}"
    else:
        r = r"textpath supports mathtext & TeX"

    text_path = TextPath((0, 0), r, size=20, usetex=usetex)

    p1 = PathPatch(text_path, ec="w", lw=3, fc="w", alpha=0.9,
                   transform=IdentityTransform())
    p2 = PathPatch(text_path, ec="none", fc="k",
                   transform=IdentityTransform())

    offsetbox2 = AuxTransformBox(IdentityTransform())
    offsetbox2.add_artist(p1)
    offsetbox2.add_artist(p2)

    ab = AnnotationBbox(offsetbox2, (0.95, 0.05),
                        xycoords='axes fraction',
                        boxcoords="offset points",
                        box_alignment=(1., 0.),
                        frameon=False
                        )
    ax1.add_artist(ab)

    ax1.imshow([[0, 1, 2], [1, 2, 3]], cmap=plt.cm.gist_gray_r,
               interpolation="bilinear", aspect="auto")

    # EXAMPLE 2

    arr = np.arange(256).reshape(1, 256) / 256

    if usetex:
        s = (r"$\displaystyle\left[\sum_{n=1}^\infty"
             r"\frac{-e^{i\pi}}{2^n}\right]$!")
    else:
        s = r"$\left[\sum_{n=1}^\infty\frac{-e^{i\pi}}{2^n}\right]$!"
    text_path = TextPath((0, 0), s, size=40, usetex=usetex)
    text_patch = PathClippedImagePatch(text_path, arr, ec="none",
                                       transform=IdentityTransform())

    shadow1 = Shadow(text_patch, 1, -1, fc="none", ec="0.6", lw=3)
    shadow2 = Shadow(text_patch, 1, -1, fc="0.3", ec="none")

    # make offset box
    offsetbox = AuxTransformBox(IdentityTransform())
    offsetbox.add_artist(shadow1)
    offsetbox.add_artist(shadow2)
    offsetbox.add_artist(text_patch)

    # place the anchored offset box using AnnotationBbox
    ab = AnnotationBbox(offsetbox, (0.5, 0.5),
                        xycoords='data',
                        boxcoords="offset points",
                        box_alignment=(0.5, 0.5),
                        )

    ax2.add_artist(ab)

    ax2.set_xlim(0, 1)
    ax2.set_ylim(0, 1)

    plt.show()
Total running time of the script: ( 0 minutes 1.873 seconds)
Keywords: matplotlib code example, codex, python plot, pyplot Gallery generated by Sphinx-Gallery