Note
Click here to download the full example code
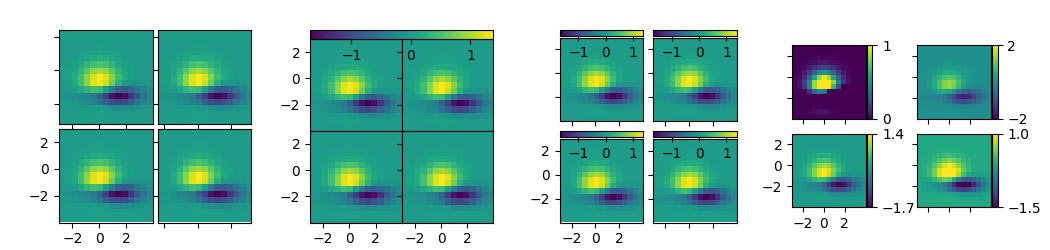
Demo Axes Grid
Grid of 2x2 images with single or own colorbar.
from matplotlib import cbook
import matplotlib.pyplot as plt
from mpl_toolkits.axes_grid1 import ImageGrid


def get_demo_image():
    z = cbook.get_sample_data("axes_grid/bivariate_normal.npy", np_load=True)
    # z is a numpy array of 15x15
    return z, (-3, 4, -4, 3)


def demo_simple_grid(fig):
    """
    A grid of 2x2 images with 0.05 inch pad between images and only
    the lower-left axes is labeled.
    """
    grid = ImageGrid(fig, 141,  # similar to subplot(141)
                     nrows_ncols=(2, 2),
                     axes_pad=0.05,
                     label_mode="1",
                     )
    Z, extent = get_demo_image()
    for ax in grid:
        ax.imshow(Z, extent=extent)
    # This only affects axes in first column and second row as share_all=False.
    grid.axes_llc.set_xticks([-2, 0, 2])
    grid.axes_llc.set_yticks([-2, 0, 2])


def demo_grid_with_single_cbar(fig):
    """
    A grid of 2x2 images with a single colorbar
    """
    grid = ImageGrid(fig, 142,  # similar to subplot(142)
                     nrows_ncols=(2, 2),
                     axes_pad=0.0,
                     share_all=True,
                     label_mode="L",
                     cbar_location="top",
                     cbar_mode="single",
                     )

    Z, extent = get_demo_image()
    for ax in grid:
        im = ax.imshow(Z, extent=extent)
    grid.cbar_axes[0].colorbar(im)

    for cax in grid.cbar_axes:
        cax.toggle_label(False)

    # This affects all axes as share_all = True.
    grid.axes_llc.set_xticks([-2, 0, 2])
    grid.axes_llc.set_yticks([-2, 0, 2])


def demo_grid_with_each_cbar(fig):
    """
    A grid of 2x2 images. Each image has its own colorbar.
    """
    grid = ImageGrid(fig, 143,  # similar to subplot(143)
                     nrows_ncols=(2, 2),
                     axes_pad=0.1,
                     label_mode="1",
                     share_all=True,
                     cbar_location="top",
                     cbar_mode="each",
                     cbar_size="7%",
                     cbar_pad="2%",
                     )
    Z, extent = get_demo_image()
    for ax, cax in zip(grid, grid.cbar_axes):
        im = ax.imshow(Z, extent=extent)
        cax.colorbar(im)
        cax.toggle_label(False)

    # This affects all axes because we set share_all = True.
    grid.axes_llc.set_xticks([-2, 0, 2])
    grid.axes_llc.set_yticks([-2, 0, 2])


def demo_grid_with_each_cbar_labelled(fig):
    """
    A grid of 2x2 images. Each image has its own colorbar.
    """
    grid = ImageGrid(fig, 144,  # similar to subplot(144)
                     nrows_ncols=(2, 2),
                     axes_pad=(0.45, 0.15),
                     label_mode="1",
                     share_all=True,
                     cbar_location="right",
                     cbar_mode="each",
                     cbar_size="7%",
                     cbar_pad="2%",
                     )
    Z, extent = get_demo_image()

    # Use a different colorbar range every time
    limits = ((0, 1), (-2, 2), (-1.7, 1.4), (-1.5, 1))
    for ax, cax, vlim in zip(grid, grid.cbar_axes, limits):
        im = ax.imshow(Z, extent=extent, vmin=vlim[0], vmax=vlim[1])
        cb = cax.colorbar(im)
        cb.set_ticks((vlim[0], vlim[1]))

    # This affects all axes because we set share_all = True.
    grid.axes_llc.set_xticks([-2, 0, 2])
    grid.axes_llc.set_yticks([-2, 0, 2])


fig = plt.figure(figsize=(10.5, 2.5))
fig.subplots_adjust(left=0.05, right=0.95)

demo_simple_grid(fig)
demo_grid_with_single_cbar(fig)
demo_grid_with_each_cbar(fig)
demo_grid_with_each_cbar_labelled(fig)

plt.show()
Total running time of the script: ( 0 minutes 1.091 seconds)
Keywords: matplotlib code example, codex, python plot, pyplot Gallery generated by Sphinx-Gallery