Note
Click here to download the full example code
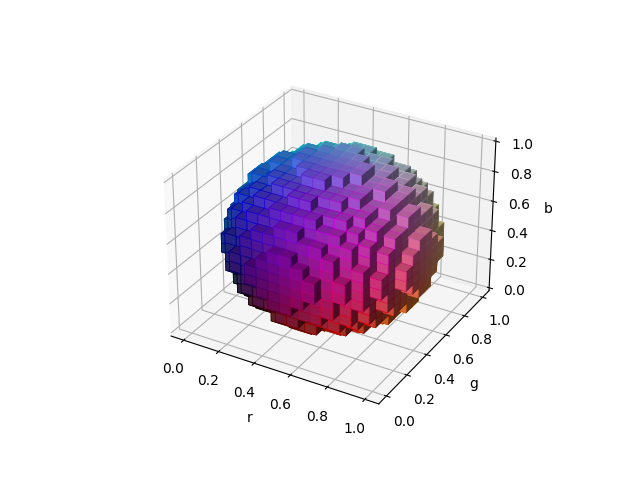
3D voxel / volumetric plot with rgb colors
Demonstrates using Axes3D.voxels to visualize parts of a color space.
import matplotlib.pyplot as plt
import numpy as np


def midpoints(x):
    sl = ()
    for i in range(x.ndim):
        x = (x[sl + np.index_exp[:-1]] + x[sl + np.index_exp[1:]]) / 2.0
        sl += np.index_exp[:]
    return x

# prepare some coordinates, and attach rgb values to each
r, g, b = np.indices((17, 17, 17)) / 16.0
rc = midpoints(r)
gc = midpoints(g)
bc = midpoints(b)

# define a sphere about [0.5, 0.5, 0.5]
sphere = (rc - 0.5)**2 + (gc - 0.5)**2 + (bc - 0.5)**2 < 0.5**2

# combine the color components
colors = np.zeros(sphere.shape + (3,))
colors[..., 0] = rc
colors[..., 1] = gc
colors[..., 2] = bc

# and plot everything
ax = plt.figure().add_subplot(projection='3d')
ax.voxels(r, g, b, sphere,
          facecolors=colors,
          edgecolors=np.clip(2*colors - 0.5, 0, 1),  # brighter
          linewidth=0.5)
ax.set(xlabel='r', ylabel='g', zlabel='b')

plt.show()
Total running time of the script: ( 0 minutes 1.797 seconds)
Keywords: matplotlib code example, codex, python plot, pyplot Gallery generated by Sphinx-Gallery