Note
Click here to download the full example code
Manual Contour
Example of displaying your own contour lines and polygons using ContourSet.
import matplotlib.pyplot as plt
from matplotlib.contour import ContourSet
import matplotlib.cm as cm
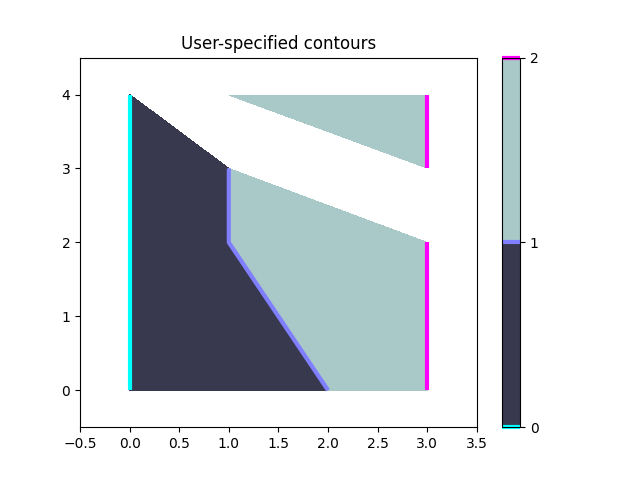
Contour lines for each level are a list/tuple of polygons.
Filled contours between two levels are also a list/tuple of polygons. Points can be ordered clockwise or anticlockwise.
fig, ax = plt.subplots()

# Filled contours using filled=True.
cs = ContourSet(ax, [0, 1, 2], [filled01, filled12], filled=True, cmap=cm.bone)
cbar = fig.colorbar(cs)

# Contour lines (non-filled).
lines = ContourSet(
    ax, [0, 1, 2], [lines0, lines1, lines2], cmap=cm.cool, linewidths=3)
cbar.add_lines(lines)

ax.set(xlim=(-0.5, 3.5), ylim=(-0.5, 4.5),
       title='User-specified contours')
Out:
[(-0.5, 3.5), (-0.5, 4.5), Text(0.5, 1.0, 'User-specified contours')]
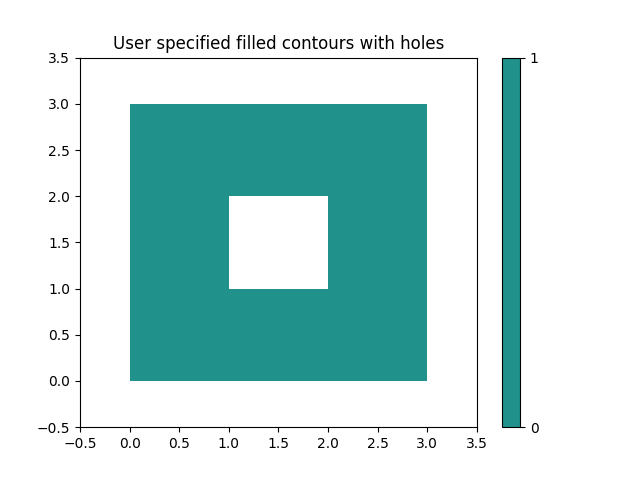
Multiple filled contour lines can be specified in a single list of polygon vertices along with a list of vertex kinds (code types) as described in the Path class. This is particularly useful for polygons with holes. Here a code type of 1 is a MOVETO, and 2 is a LINETO.
fig, ax = plt.subplots()
filled01 = [[[0, 0], [3, 0], [3, 3], [0, 3], [1, 1], [1, 2], [2, 2], [2, 1]]]
kinds01 = [[1, 2, 2, 2, 1, 2, 2, 2]]
cs = ContourSet(ax, [0, 1], [filled01], [kinds01], filled=True)
cbar = fig.colorbar(cs)

ax.set(xlim=(-0.5, 3.5), ylim=(-0.5, 3.5),
       title='User specified filled contours with holes')

plt.show()
Keywords: matplotlib code example, codex, python plot, pyplot Gallery generated by Sphinx-Gallery