Note
Click here to download the full example code
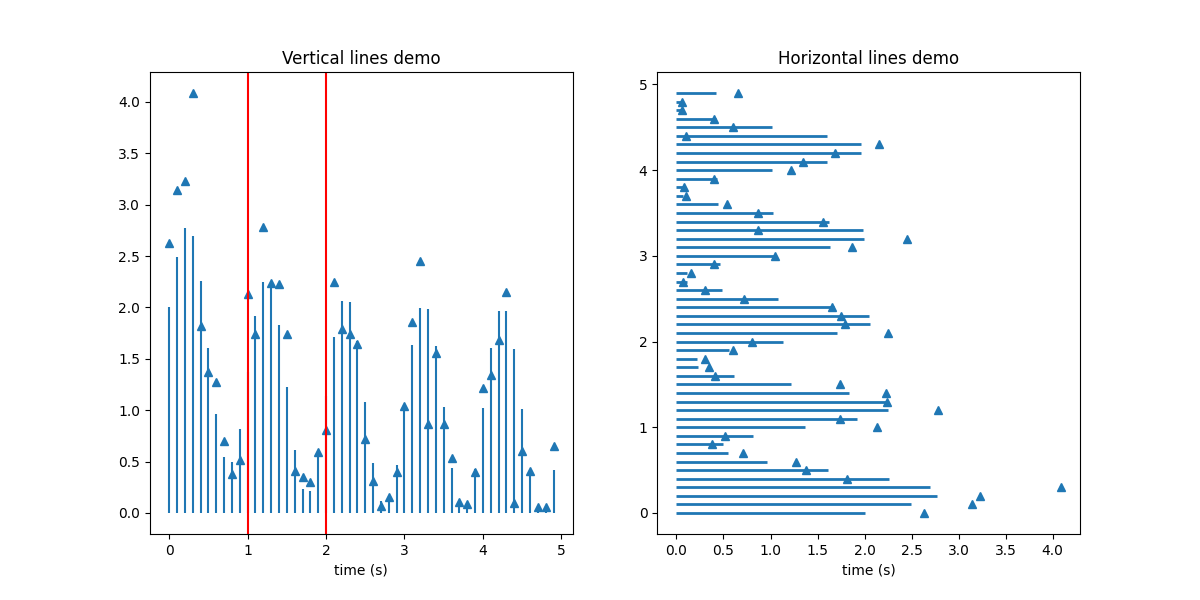
hlines and vlines
This example showcases the functions hlines and vlines.
import matplotlib.pyplot as plt
import numpy as np


# Fixing random state for reproducibility
np.random.seed(19680801)

t = np.arange(0.0, 5.0, 0.1)
s = np.exp(-t) + np.sin(2 * np.pi * t) + 1
nse = np.random.normal(0.0, 0.3, t.shape) * s

fig, (vax, hax) = plt.subplots(1, 2, figsize=(12, 6))

vax.plot(t, s + nse, '^')
vax.vlines(t, [0], s)
# By using ``transform=vax.get_xaxis_transform()`` the y coordinates are scaled
# such that 0 maps to the bottom of the axes and 1 to the top.
vax.vlines([1, 2], 0, 1, transform=vax.get_xaxis_transform(), colors='r')
vax.set_xlabel('time (s)')
vax.set_title('Vertical lines demo')

hax.plot(s + nse, t, '^')
hax.hlines(t, [0], s, lw=2)
hax.set_xlabel('time (s)')
hax.set_title('Horizontal lines demo')

plt.show()
Keywords: matplotlib code example, codex, python plot, pyplot Gallery generated by Sphinx-Gallery