Note
Click here to download the full example code
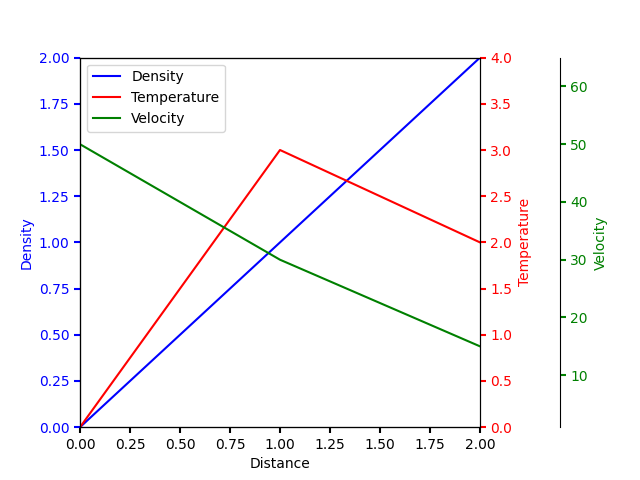
Multiple Yaxis With Spines
Create multiple y axes with a shared x axis. This is done by creating
a twinx axes, turning all spines but the right one invisible
and offset its position using set_position.
Note that this approach uses matplotlib.axes.Axes and their
Spines. An alternative approach for parasite
axes is shown in the Parasite Axes demo and
Parasite axis demo examples.
import matplotlib.pyplot as plt


fig, ax = plt.subplots()
fig.subplots_adjust(right=0.75)

twin1 = ax.twinx()
twin2 = ax.twinx()

# Offset the right spine of twin2.  The ticks and label have already been
# placed on the right by twinx above.
twin2.spines.right.set_position(("axes", 1.2))

p1, = ax.plot([0, 1, 2], [0, 1, 2], "b-", label="Density")
p2, = twin1.plot([0, 1, 2], [0, 3, 2], "r-", label="Temperature")
p3, = twin2.plot([0, 1, 2], [50, 30, 15], "g-", label="Velocity")

ax.set_xlim(0, 2)
ax.set_ylim(0, 2)
twin1.set_ylim(0, 4)
twin2.set_ylim(1, 65)

ax.set_xlabel("Distance")
ax.set_ylabel("Density")
twin1.set_ylabel("Temperature")
twin2.set_ylabel("Velocity")

ax.yaxis.label.set_color(p1.get_color())
twin1.yaxis.label.set_color(p2.get_color())
twin2.yaxis.label.set_color(p3.get_color())

tkw = dict(size=4, width=1.5)
ax.tick_params(axis='y', colors=p1.get_color(), **tkw)
twin1.tick_params(axis='y', colors=p2.get_color(), **tkw)
twin2.tick_params(axis='y', colors=p3.get_color(), **tkw)
ax.tick_params(axis='x', **tkw)

ax.legend(handles=[p1, p2, p3])

plt.show()
Keywords: matplotlib code example, codex, python plot, pyplot Gallery generated by Sphinx-Gallery