Note
Click here to download the full example code
Programmatically controlling subplot adjustment
Note
This example is primarily intended to show some advanced concepts in Matplotlib.
If you are only looking for having enough space for your labels, it is
almost always simpler and good enough to either set the subplot parameters
manually using Figure.subplots_adjust, or use one of the automatic
layout mechanisms
(Constrained Layout Guide or
Tight Layout guide).
This example describes a user-defined way to read out Artist sizes and set the subplot parameters accordingly. Its main purpose is to illustrate some advanced concepts like reading out text positions, working with bounding boxes and transforms and using events. But it can also serve as a starting point if you want to automate the layouting and need more flexibility than tight layout and constrained layout.
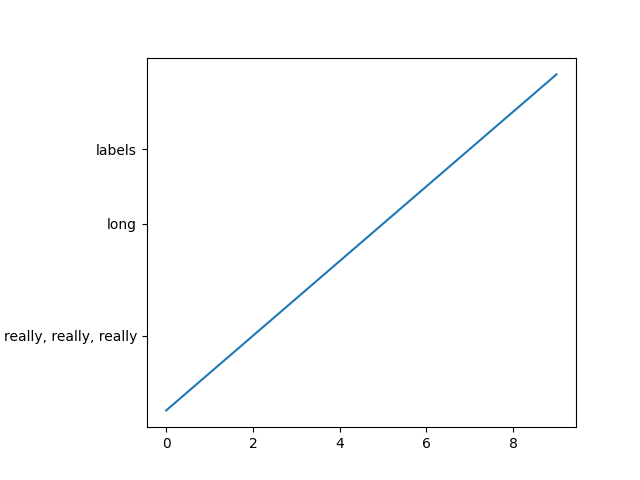
Below, we collect the bounding boxes of all y-labels and move the left border of the subplot to the right so that it leaves enough room for the union of all the bounding boxes.
There's one catch with calculating text bounding boxes:
Querying the text bounding boxes (Text.get_window_extent) needs a
renderer (RendererBase instance), to calculate the text size. This renderer
is only available after the figure has been drawn (Figure.draw).
A solution to this is putting the adjustment logic in a draw callback. This function is executed after the figure has been drawn. It can now check if the subplot leaves enough room for the text. If not, the subplot parameters are updated and second draw is triggered.
import matplotlib.pyplot as plt
import matplotlib.transforms as mtransforms

fig, ax = plt.subplots()
ax.plot(range(10))
ax.set_yticks([2, 5, 7], labels=['really, really, really', 'long', 'labels'])


def on_draw(event):
    bboxes = []
    for label in ax.get_yticklabels():
        # Bounding box in pixels
        bbox_px = label.get_window_extent()
        # Transform to relative figure coordinates. This is the inverse of
        # transFigure.
        bbox_fig = bbox_px.transformed(fig.transFigure.inverted())
        bboxes.append(bbox_fig)
    # the bbox that bounds all the bboxes, again in relative figure coords
    bbox = mtransforms.Bbox.union(bboxes)
    if fig.subplotpars.left < bbox.width:
        # Move the subplot left edge more to the right
        fig.subplots_adjust(left=1.1*bbox.width)  # pad a little
        fig.canvas.draw()


fig.canvas.mpl_connect('draw_event', on_draw)

plt.show()
References
The use of the following functions, methods, classes and modules is shown in this example:
Keywords: matplotlib code example, codex, python plot, pyplot Gallery generated by Sphinx-Gallery