Note
Click here to download the full example code
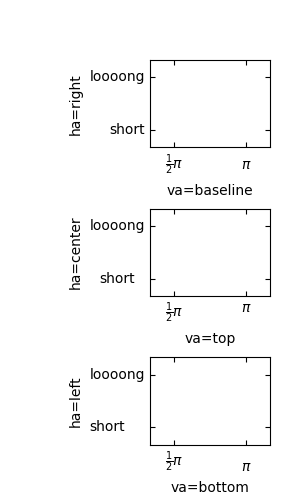
Ticklabel alignment
import matplotlib.pyplot as plt
import mpl_toolkits.axisartist as axisartist


def setup_axes(fig, pos):
    ax = fig.add_subplot(pos, axes_class=axisartist.Axes)
    ax.set_yticks([0.2, 0.8], labels=["short", "loooong"])
    ax.set_xticks([0.2, 0.8], labels=[r"$\frac{1}{2}\pi$", r"$\pi$"])
    return ax


fig = plt.figure(figsize=(3, 5))
fig.subplots_adjust(left=0.5, hspace=0.7)

ax = setup_axes(fig, 311)
ax.set_ylabel("ha=right")
ax.set_xlabel("va=baseline")

ax = setup_axes(fig, 312)
ax.axis["left"].major_ticklabels.set_ha("center")
ax.axis["bottom"].major_ticklabels.set_va("top")
ax.set_ylabel("ha=center")
ax.set_xlabel("va=top")

ax = setup_axes(fig, 313)
ax.axis["left"].major_ticklabels.set_ha("left")
ax.axis["bottom"].major_ticklabels.set_va("bottom")
ax.set_ylabel("ha=left")
ax.set_xlabel("va=bottom")

plt.show()
Keywords: matplotlib code example, codex, python plot, pyplot Gallery generated by Sphinx-Gallery