Note
Click here to download the full example code
Inset Locator Demo
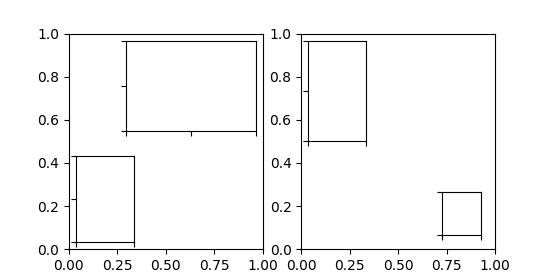
The inset_locator's inset_axes allows
easily placing insets in the corners of the axes by specifying a width and
height and optionally a location (loc) that accepts locations as codes,
similar to legend.
By default, the inset is offset by some points from the axes,
controlled via the borderpad parameter.
import matplotlib.pyplot as plt
from mpl_toolkits.axes_grid1.inset_locator import inset_axes


fig, (ax, ax2) = plt.subplots(1, 2, figsize=[5.5, 2.8])

# Create inset of width 1.3 inches and height 0.9 inches
# at the default upper right location
axins = inset_axes(ax, width=1.3, height=0.9)

# Create inset of width 30% and height 40% of the parent axes' bounding box
# at the lower left corner (loc=3)
axins2 = inset_axes(ax, width="30%", height="40%", loc=3)

# Create inset of mixed specifications in the second subplot;
# width is 30% of parent axes' bounding box and
# height is 1 inch at the upper left corner (loc=2)
axins3 = inset_axes(ax2, width="30%", height=1., loc=2)

# Create an inset in the lower right corner (loc=4) with borderpad=1, i.e.
# 10 points padding (as 10pt is the default fontsize) to the parent axes
axins4 = inset_axes(ax2, width="20%", height="20%", loc=4, borderpad=1)

# Turn ticklabels of insets off
for axi in [axins, axins2, axins3, axins4]:
    axi.tick_params(labelleft=False, labelbottom=False)

plt.show()
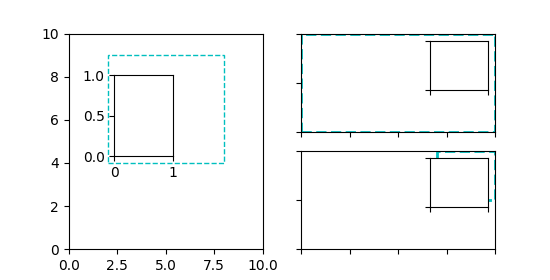
The parameters bbox_to_anchor and bbox_transform can be used for a more fine grained control over the inset position and size or even to position the inset at completely arbitrary positions. The bbox_to_anchor sets the bounding box in coordinates according to the bbox_transform.
fig = plt.figure(figsize=[5.5, 2.8])
ax = fig.add_subplot(121)

# We use the axes transform as bbox_transform. Therefore the bounding box
# needs to be specified in axes coordinates ((0, 0) is the lower left corner
# of the axes, (1, 1) is the upper right corner).
# The bounding box (.2, .4, .6, .5) starts at (.2, .4) and ranges to (.8, .9)
# in those coordinates.
# Inside of this bounding box an inset of half the bounding box' width and
# three quarters of the bounding box' height is created. The lower left corner
# of the inset is aligned to the lower left corner of the bounding box (loc=3).
# The inset is then offset by the default 0.5 in units of the font size.

axins = inset_axes(ax, width="50%", height="75%",
                   bbox_to_anchor=(.2, .4, .6, .5),
                   bbox_transform=ax.transAxes, loc=3)

# For visualization purposes we mark the bounding box by a rectangle
ax.add_patch(plt.Rectangle((.2, .4), .6, .5, ls="--", ec="c", fc="none",
                           transform=ax.transAxes))

# We set the axis limits to something other than the default, in order to not
# distract from the fact that axes coordinates are used here.
ax.set(xlim=(0, 10), ylim=(0, 10))


# Note how the two following insets are created at the same positions, one by
# use of the default parent axes' bbox and the other via a bbox in axes
# coordinates and the respective transform.
ax2 = fig.add_subplot(222)
axins2 = inset_axes(ax2, width="30%", height="50%")

ax3 = fig.add_subplot(224)
axins3 = inset_axes(ax3, width="100%", height="100%",
                    bbox_to_anchor=(.7, .5, .3, .5),
                    bbox_transform=ax3.transAxes)

# For visualization purposes we mark the bounding box by a rectangle
ax2.add_patch(plt.Rectangle((0, 0), 1, 1, ls="--", lw=2, ec="c", fc="none"))
ax3.add_patch(plt.Rectangle((.7, .5), .3, .5, ls="--", lw=2,
                            ec="c", fc="none"))

# Turn ticklabels off
for axi in [axins2, axins3, ax2, ax3]:
    axi.tick_params(labelleft=False, labelbottom=False)

plt.show()
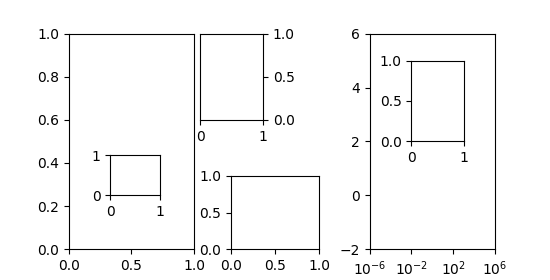
In the above the axes transform together with 4-tuple bounding boxes has been used as it mostly is useful to specify an inset relative to the axes it is an inset to. However other use cases are equally possible. The following example examines some of those.
fig = plt.figure(figsize=[5.5, 2.8])
ax = fig.add_subplot(131)

# Create an inset outside the axes
axins = inset_axes(ax, width="100%", height="100%",
                   bbox_to_anchor=(1.05, .6, .5, .4),
                   bbox_transform=ax.transAxes, loc=2, borderpad=0)
axins.tick_params(left=False, right=True, labelleft=False, labelright=True)

# Create an inset with a 2-tuple bounding box. Note that this creates a
# bbox without extent. This hence only makes sense when specifying
# width and height in absolute units (inches).
axins2 = inset_axes(ax, width=0.5, height=0.4,
                    bbox_to_anchor=(0.33, 0.25),
                    bbox_transform=ax.transAxes, loc=3, borderpad=0)


ax2 = fig.add_subplot(133)
ax2.set_xscale("log")
ax2.set(xlim=(1e-6, 1e6), ylim=(-2, 6))

# Create inset in data coordinates using ax.transData as transform
axins3 = inset_axes(ax2, width="100%", height="100%",
                    bbox_to_anchor=(1e-2, 2, 1e3, 3),
                    bbox_transform=ax2.transData, loc=2, borderpad=0)

# Create an inset horizontally centered in figure coordinates and vertically
# bound to line up with the axes.
from matplotlib.transforms import blended_transform_factory  # noqa
transform = blended_transform_factory(fig.transFigure, ax2.transAxes)
axins4 = inset_axes(ax2, width="16%", height="34%",
                    bbox_to_anchor=(0, 0, 1, 1),
                    bbox_transform=transform, loc=8, borderpad=0)

plt.show()
Total running time of the script: ( 0 minutes 1.081 seconds)
Keywords: matplotlib code example, codex, python plot, pyplot Gallery generated by Sphinx-Gallery