Note
Click here to download the full example code
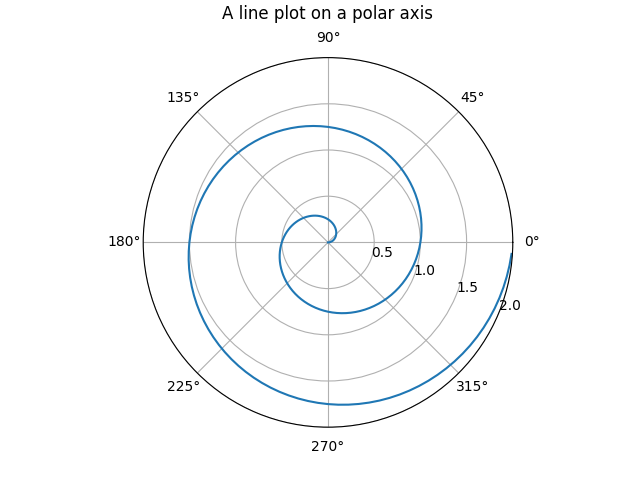
Polar plot
Demo of a line plot on a polar axis.
import numpy as np
import matplotlib.pyplot as plt


r = np.arange(0, 2, 0.01)
theta = 2 * np.pi * r

fig, ax = plt.subplots(subplot_kw={'projection': 'polar'})
ax.plot(theta, r)
ax.set_rmax(2)
ax.set_rticks([0.5, 1, 1.5, 2])  # Less radial ticks
ax.set_rlabel_position(-22.5)  # Move radial labels away from plotted line
ax.grid(True)

ax.set_title("A line plot on a polar axis", va='bottom')
plt.show()
References
The use of the following functions, methods, classes and modules is shown in this example:
Keywords: matplotlib code example, codex, python plot, pyplot Gallery generated by Sphinx-Gallery