Note
Click here to download the full example code
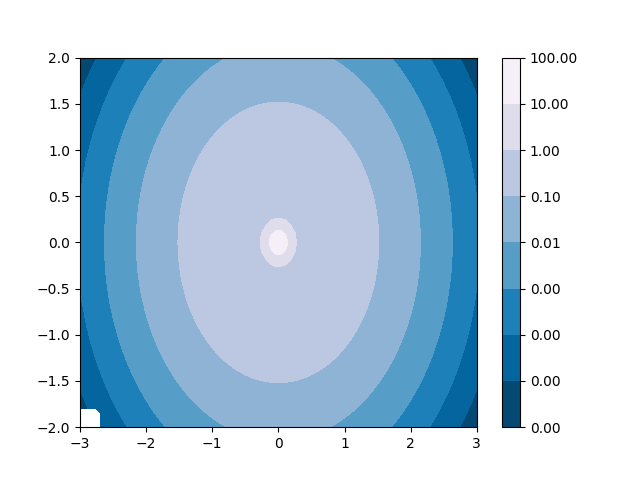
Contourf and log color scale
Demonstrate use of a log color scale in contourf
import matplotlib.pyplot as plt
import numpy as np
from numpy import ma
from matplotlib import ticker, cm

N = 100
x = np.linspace(-3.0, 3.0, N)
y = np.linspace(-2.0, 2.0, N)

X, Y = np.meshgrid(x, y)

# A low hump with a spike coming out.
# Needs to have z/colour axis on a log scale so we see both hump and spike.
# linear scale only shows the spike.
Z1 = np.exp(-X**2 - Y**2)
Z2 = np.exp(-(X * 10)**2 - (Y * 10)**2)
z = Z1 + 50 * Z2

# Put in some negative values (lower left corner) to cause trouble with logs:
z[:5, :5] = -1

# The following is not strictly essential, but it will eliminate
# a warning.  Comment it out to see the warning.
z = ma.masked_where(z <= 0, z)


# Automatic selection of levels works; setting the
# log locator tells contourf to use a log scale:
fig, ax = plt.subplots()
cs = ax.contourf(X, Y, z, locator=ticker.LogLocator(), cmap=cm.PuBu_r)

# Alternatively, you can manually set the levels
# and the norm:
# lev_exp = np.arange(np.floor(np.log10(z.min())-1),
#                    np.ceil(np.log10(z.max())+1))
# levs = np.power(10, lev_exp)
# cs = ax.contourf(X, Y, z, levs, norm=colors.LogNorm())

cbar = fig.colorbar(cs)

plt.show()
References
The use of the following functions, methods, classes and modules is shown in this example:
Keywords: matplotlib code example, codex, python plot, pyplot Gallery generated by Sphinx-Gallery