Note
Click here to download the full example code
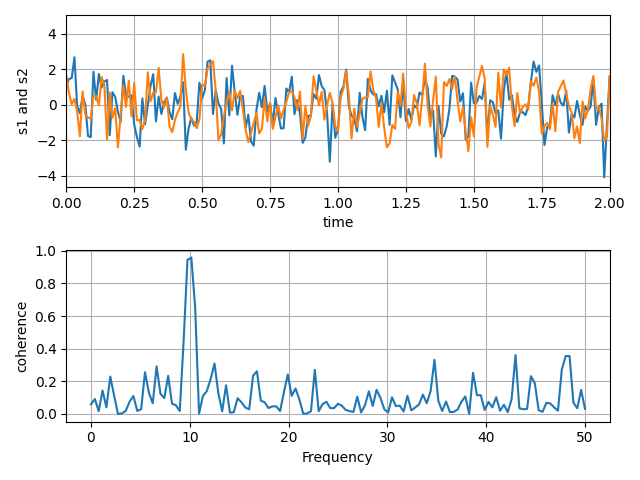
Plotting the coherence of two signals
An example showing how to plot the coherence of two signals.
import numpy as np
import matplotlib.pyplot as plt

# Fixing random state for reproducibility
np.random.seed(19680801)

dt = 0.01
t = np.arange(0, 30, dt)
nse1 = np.random.randn(len(t))                 # white noise 1
nse2 = np.random.randn(len(t))                 # white noise 2

# Two signals with a coherent part at 10Hz and a random part
s1 = np.sin(2 * np.pi * 10 * t) + nse1
s2 = np.sin(2 * np.pi * 10 * t) + nse2

fig, axs = plt.subplots(2, 1)
axs[0].plot(t, s1, t, s2)
axs[0].set_xlim(0, 2)
axs[0].set_xlabel('time')
axs[0].set_ylabel('s1 and s2')
axs[0].grid(True)

cxy, f = axs[1].cohere(s1, s2, 256, 1. / dt)
axs[1].set_ylabel('coherence')

fig.tight_layout()
plt.show()
Keywords: matplotlib code example, codex, python plot, pyplot Gallery generated by Sphinx-Gallery