Note
Click here to download the full example code
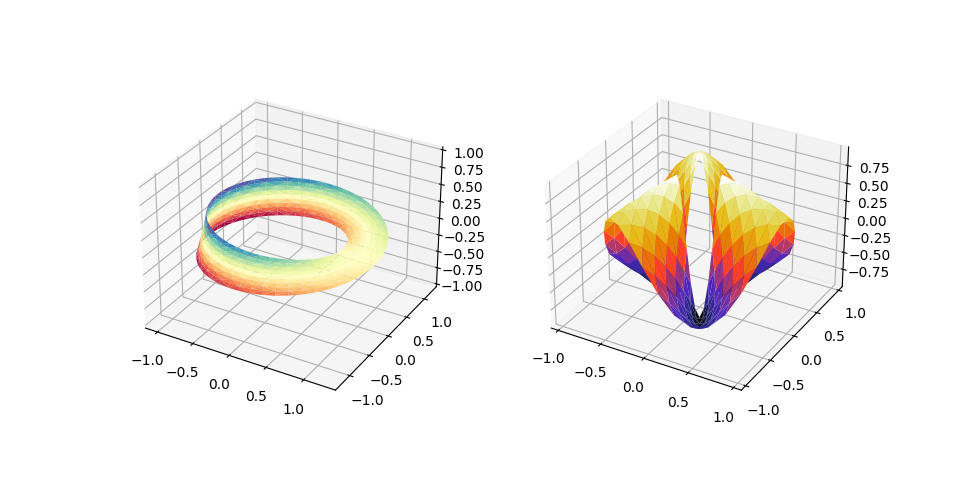
More triangular 3D surfaces
Two additional examples of plotting surfaces with triangular mesh.
The first demonstrates use of plot_trisurf's triangles argument, and the second sets a Triangulation object's mask and passes the object directly to plot_trisurf.
import numpy as np
import matplotlib.pyplot as plt
import matplotlib.tri as mtri


fig = plt.figure(figsize=plt.figaspect(0.5))

# ==========
# First plot
# ==========

# Make a mesh in the space of parameterisation variables u and v
u = np.linspace(0, 2.0 * np.pi, endpoint=True, num=50)
v = np.linspace(-0.5, 0.5, endpoint=True, num=10)
u, v = np.meshgrid(u, v)
u, v = u.flatten(), v.flatten()

# This is the Mobius mapping, taking a u, v pair and returning an x, y, z
# triple
x = (1 + 0.5 * v * np.cos(u / 2.0)) * np.cos(u)
y = (1 + 0.5 * v * np.cos(u / 2.0)) * np.sin(u)
z = 0.5 * v * np.sin(u / 2.0)

# Triangulate parameter space to determine the triangles
tri = mtri.Triangulation(u, v)

# Plot the surface.  The triangles in parameter space determine which x, y, z
# points are connected by an edge.
ax = fig.add_subplot(1, 2, 1, projection='3d')
ax.plot_trisurf(x, y, z, triangles=tri.triangles, cmap=plt.cm.Spectral)
ax.set_zlim(-1, 1)


# ===========
# Second plot
# ===========

# Make parameter spaces radii and angles.
n_angles = 36
n_radii = 8
min_radius = 0.25
radii = np.linspace(min_radius, 0.95, n_radii)

angles = np.linspace(0, 2*np.pi, n_angles, endpoint=False)
angles = np.repeat(angles[..., np.newaxis], n_radii, axis=1)
angles[:, 1::2] += np.pi/n_angles

# Map radius, angle pairs to x, y, z points.
x = (radii*np.cos(angles)).flatten()
y = (radii*np.sin(angles)).flatten()
z = (np.cos(radii)*np.cos(3*angles)).flatten()

# Create the Triangulation; no triangles so Delaunay triangulation created.
triang = mtri.Triangulation(x, y)

# Mask off unwanted triangles.
xmid = x[triang.triangles].mean(axis=1)
ymid = y[triang.triangles].mean(axis=1)
mask = xmid**2 + ymid**2 < min_radius**2
triang.set_mask(mask)

# Plot the surface.
ax = fig.add_subplot(1, 2, 2, projection='3d')
ax.plot_trisurf(triang, z, cmap=plt.cm.CMRmap)


plt.show()
Total running time of the script: ( 0 minutes 1.039 seconds)
Keywords: matplotlib code example, codex, python plot, pyplot Gallery generated by Sphinx-Gallery