Note
Click here to download the full example code
Stairs Demo
This example demonstrates the use of stairs for stepwise
constant functions. A common use case is histogram and histogram-like data
visualization.
import numpy as np
import matplotlib.pyplot as plt
from matplotlib.patches import StepPatch
np.random.seed(0)
h, edges = np.histogram(np.random.normal(5, 3, 5000),
bins=np.linspace(0, 10, 20))
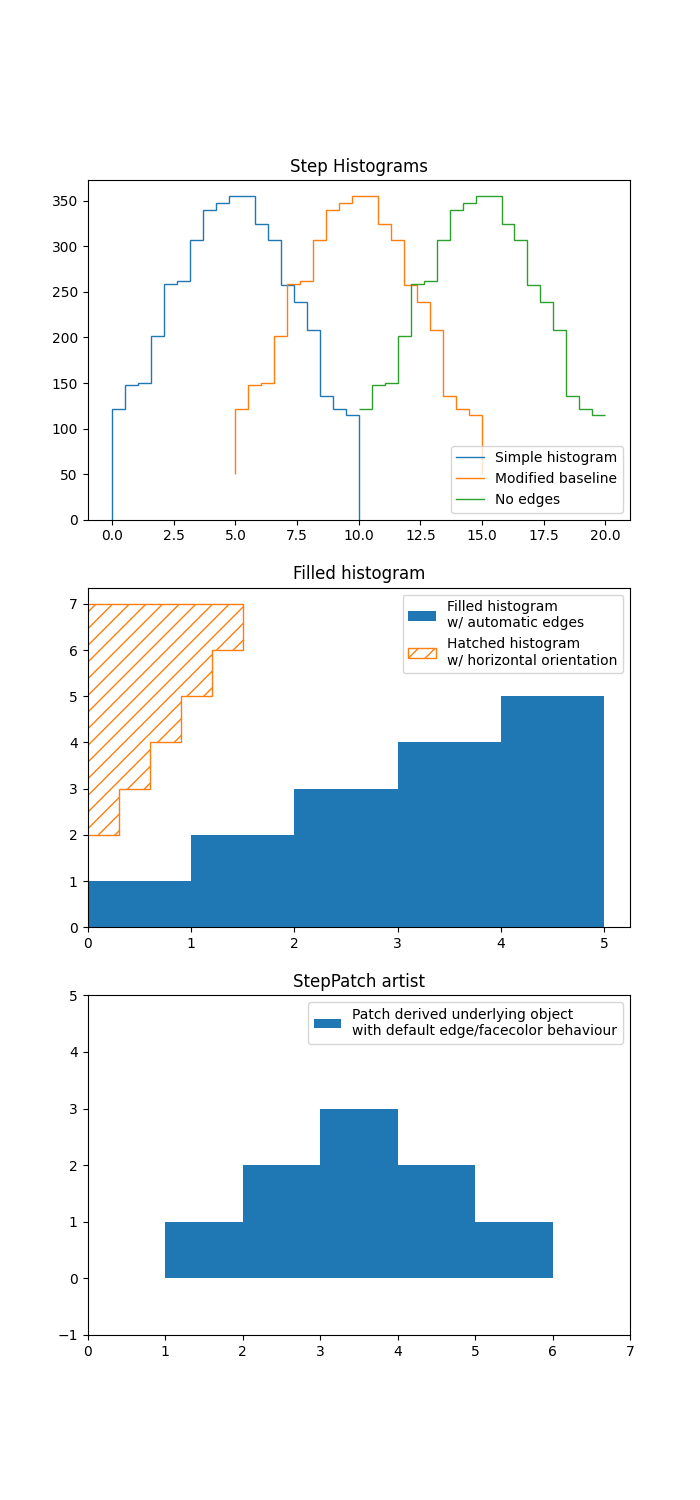
fig, axs = plt.subplots(3, 1, figsize=(7, 15))
axs[0].stairs(h, edges, label='Simple histogram')
axs[0].stairs(h, edges + 5, baseline=50, label='Modified baseline')
axs[0].stairs(h, edges + 10, baseline=None, label='No edges')
axs[0].set_title("Step Histograms")
axs[1].stairs(np.arange(1, 6, 1), fill=True,
label='Filled histogram\nw/ automatic edges')
axs[1].stairs(np.arange(1, 6, 1)*0.3, np.arange(2, 8, 1),
orientation='horizontal', hatch='//',
label='Hatched histogram\nw/ horizontal orientation')
axs[1].set_title("Filled histogram")
patch = StepPatch(values=[1, 2, 3, 2, 1],
edges=range(1, 7),
label=('Patch derived underlying object\n'
'with default edge/facecolor behaviour'))
axs[2].add_patch(patch)
axs[2].set_xlim(0, 7)
axs[2].set_ylim(-1, 5)
axs[2].set_title("StepPatch artist")
for ax in axs:
ax.legend()
plt.show()
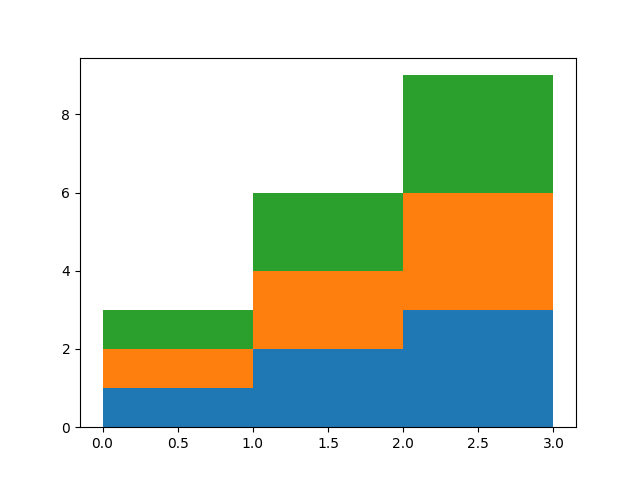
baseline can take an array to allow for stacked histogram plots
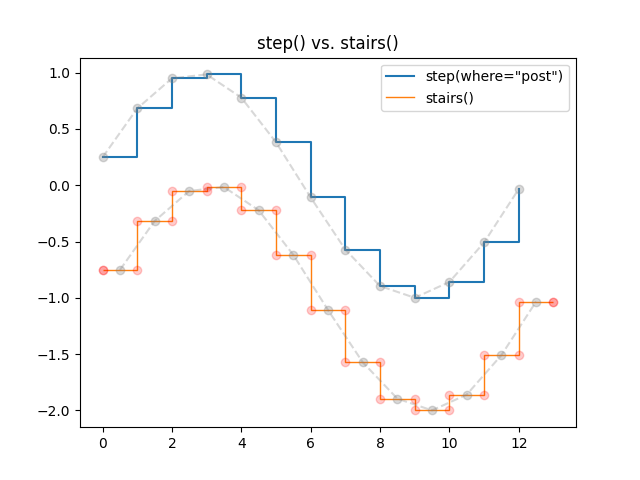
Comparison of pyplot.step and pyplot.stairs
pyplot.step defines the positions of the steps as single values. The steps
extend left/right/both ways from these reference values depending on the
parameter where. The number of x and y values is the same.
In contrast, pyplot.stairs defines the positions of the steps via their
bounds edges, which is one element longer than the step values.
bins = np.arange(14)
centers = bins[:-1] + np.diff(bins) / 2
y = np.sin(centers / 2)

plt.step(bins[:-1], y, where='post', label='step(where="post")')
plt.plot(bins[:-1], y, 'o--', color='grey', alpha=0.3)

plt.stairs(y - 1, bins, baseline=None, label='stairs()')
plt.plot(centers, y - 1, 'o--', color='grey', alpha=0.3)
plt.plot(np.repeat(bins, 2), np.hstack([y[0], np.repeat(y, 2), y[-1]]) - 1,
         'o', color='red', alpha=0.2)

plt.legend()
plt.title('step() vs. stairs()')
plt.show()
References
The use of the following functions, methods, classes and modules is shown in this example:
Total running time of the script: ( 0 minutes 2.050 seconds)
Keywords: matplotlib code example, codex, python plot, pyplot Gallery generated by Sphinx-Gallery